VIPs
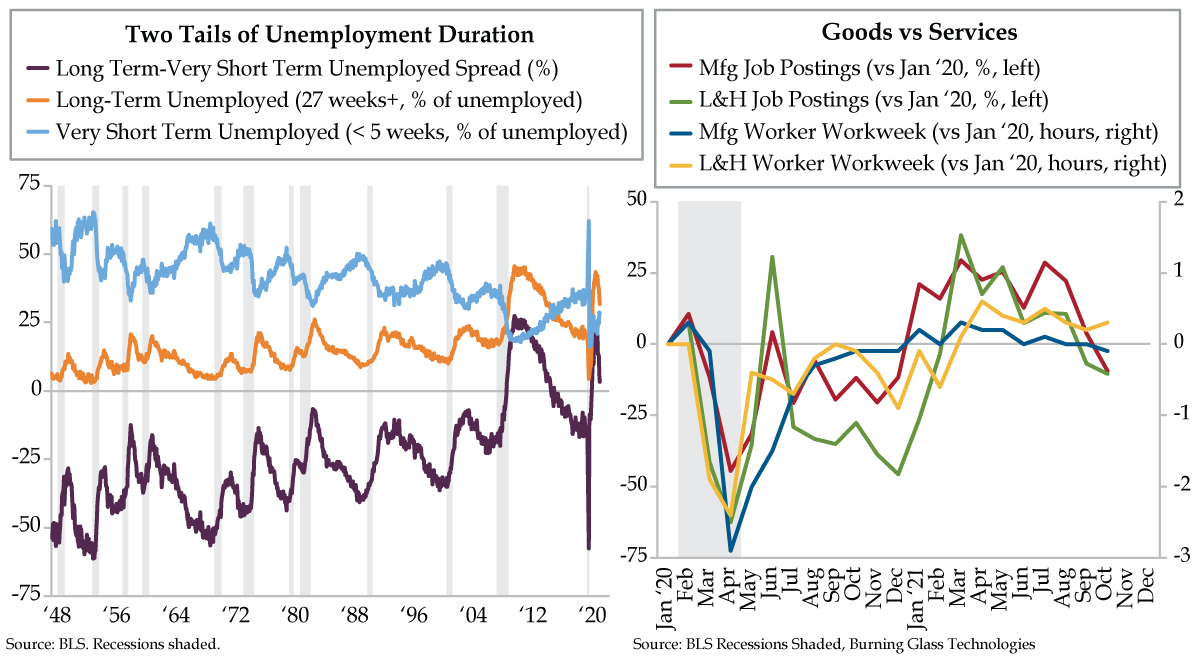
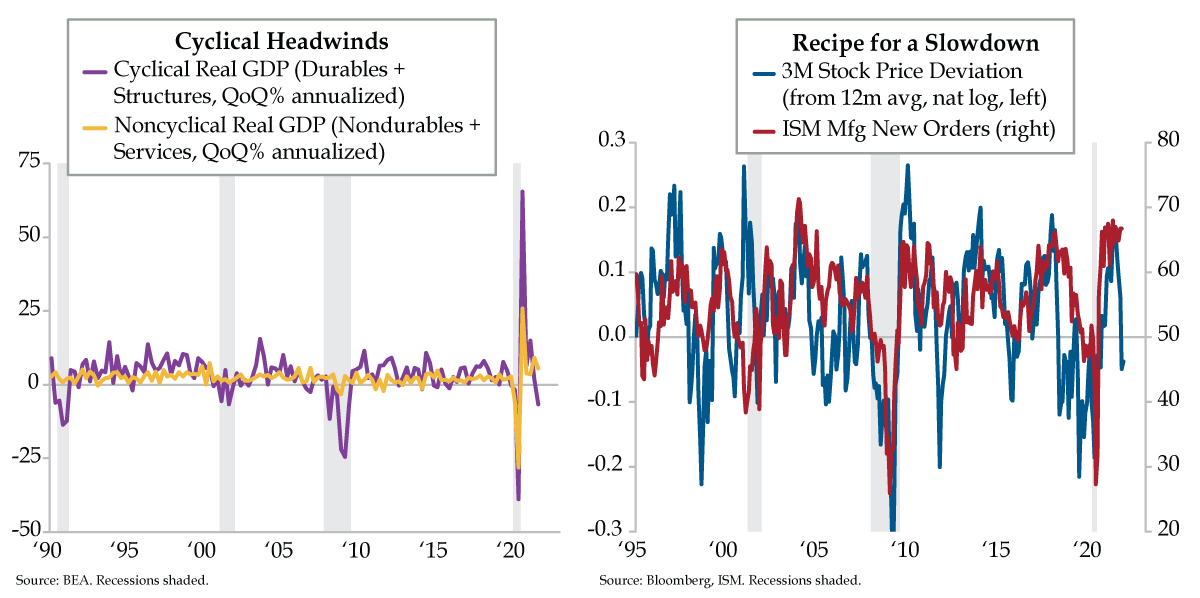
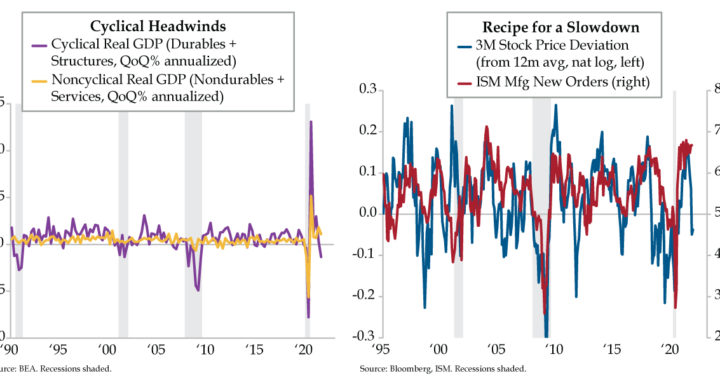
- Driven by services, consumption added 1.09 percentage points to Q3 headline GDP; goods spending, which shaved 2.3 ppts off GDP contribution to real spending, was flattered by services and non-durables, which slumped to a 5.4% QoQ pace from Q3 2020’s +25.9% print
- Inflation-adjusted growth in durables and construction spend fell to a -6.8% QoQ pace in Q3, down from 2020’s 65.4% record; meanwhile, per BofA, with a 19% 2-yr growth rate that’s 6 ppts above the summer average, services spending remains driven by higher income earners
- 3M’s stock price remains a cyclical stalwart, deviating from its 12-month trend in recent years only during the Euro crisis, the mid-2010s industrials recession, and today; the stocks’ correlation with ISM New Orders suggests an unexpected downside from the latter indicator
Asa Candler, Jr. felt the need for speed. In early 1909, the son of Coca-Cola founder and future Atlanta mayor Asa Griggs Candler had a vision to satisfy that need. Driven to compete with the recently announced raceway in Indianapolis, Candler set out to build a racetrack that would put car racing squarely in the heart of the Peach State. Candler and business partner Ed Durant quietly bought up properties along Virginia Avenue south of Atlanta. If you fancy yourself an archivist, you can find the original blueprint showing parcels of land purchased from Hapeville residents in the Candler papers at the Rose Library Rare Papers Archive at Emory University. It took 1,000 mostly unpaid prison workers all of five months to build the two-mile raceway. Alas, interest in racing didn’t even make it past a second season. Asa Candler, Sr. cut his losses and closed the track which subsequently underwent foreclosure. The savvy businessman reacquired the abandoned half-million property for $1,000 in 1914. Five years later, the property was donated for the purpose of an ‘aero landing place.”
Today, Hartsfield–Jackson Atlanta International Airport is the nation’s busiest by passenger traffic with about 104 million traveling through it, about 20 million more than for the second busiest airport in the US. For 19 straight years, Hartsfield has also been deemed the most efficient U.S. airport. This evening, QI will fly into Atlanta, doing our fair share to sustain the services spending that helped improve air passenger traffic to -20.2% in the week ended October 25th vs. the same week in 2019, a 1.2% improvement over the prior week. Clearly, our endeavoring to travel feeds the trend that lifted services spending by the 7.9% annualized pace in the third quarter GDP report that electrified markets Thursday morning. Overall, consumption added 1.09 percentage points (ppts) to headline GDP, with services adding 3.4 ppts, a tidy offset to goods contracting by 2.3 ppts.
For all of the hullabaloo, services spending declined in the three months ended September from a pace of 11.5% in the second quarter. The swing for goods was appreciably more pronounced – from +13% to -9.2% in the third quarter. As you see in the yellow line on today’s left chart, when you combine the contribution to economic output of inflation-adjusted spending on services and nondurables, the pace has slumped to a 5.4% quarter-over-quarter (QoQ) pace from 25.9% in 2020’s third quarter. As dramatic a pendulum swing as this is, services and nondurables don’t serve the role of leading indicators.
Monday’s release of September’s Chicago Fed National Activity Index (CFNAI) presaged the violence depicted in the purple line, which does lead the broader economy. When broken down into baskets, the only positive contributors were Employment & Hours and Sales, Orders & Inventories. These were more than counterbalanced by the negative drag of Production & Income. Say what you will about the relatively scant contribution of the non-services U.S. economy. Consider us old fuddy-duddy’s as long as cyclicals continue to successfully flag inflection points in the economic cycle, which brings us back to that purple line. In 2020’s third quarter, the sum of inflation adjusted QoQ growth in durables and structures (residential & nonresidential construction) was a postwar record 65.4%; one year on, it’s back in the red, at a -6.8% pace, the sickliest since the pandemic quarter that ended in March 2020.
We’ve been forewarned by the slowdown in China’s cyclical sector which, like it or not, is still the global marginal industrial signpost. And as our friends at the China Beige Book (CBB) astutely point out, China may be in clampdown mode beyond February’s Paralympics closing ceremonies. As CBB tweeted out yesterday, “We’ve cautioned about getting head-faked by a relaxation of policy crackdowns in the run-up to the 6th Plenum or Olympics. This ‘campaign’ is not about the Olympics nor Big Tech. The bigger picture doesn’t change until post-fall 2022 Party Congress, at the earliest.” That’s a year from now, folks, just as Americans head to the polls for what promise to be bloody Midterm elections.
For those of us paying attention, the good news is real-time indicators have long since broadcast the headlines to come. It’s called the price of 3M’s stock (blue line). Study the recent dips below trend. Aside from recessions and the initial shock of the pandemic, the stock price of this cyclical stalwart has deviated negatively from its 12-month trend three times in recent years – during the Euro crisis, the 2015/2016 industrials recession…and today. You don’t have to be a rocket scientist to know what’s to come for the red line, the one indicator that freaks out stock jocks almost as much as that initial nonfarm payroll print – ISM New Orders.
It’s an inconvenient truth that services spending continues to rise. Why the dour characterization? According to Bank of America, the catch is the sole driver is the wealthy: “The gain in spending amongst the higher income cohort continues, running at a 19% 2-year growth rate, which is 6 ppts above the summer average. This is a decisive turn higher that is not evident in the lower income cohort. We think this differential largely owes to the reengagement of leisure service spending which, on balance, is a higher share of higher income consumer baskets.” It’s almost as if we were looking at the U.S. economy through a microcosm of a circa 1910 failed racetrack.