10.12.21-Canadian-Labor-Shortages

Canada’s Curve to Stay Flatter

QI TAKEAWAY —  Canada’s labor market has fully recovered. Upstream costs pressures on Main Street point to persistent inflation risks downstream. Watch for Canada’s yield curve to stay flatter than that of the U.S. These rate differentials suggest favoring U.S. banks over Canadian ones.

10.12.21-Canadian-Labor-Shortages

  1. Canada saw 157,000 jobs gained last month, more than 2.5 times the consensus and above every estimate in the Bloomberg survey; the 0.8% MoM pushed employment back to pre-pandemic levels and would have translated to a proportional 1.2 million bump in the U.S.
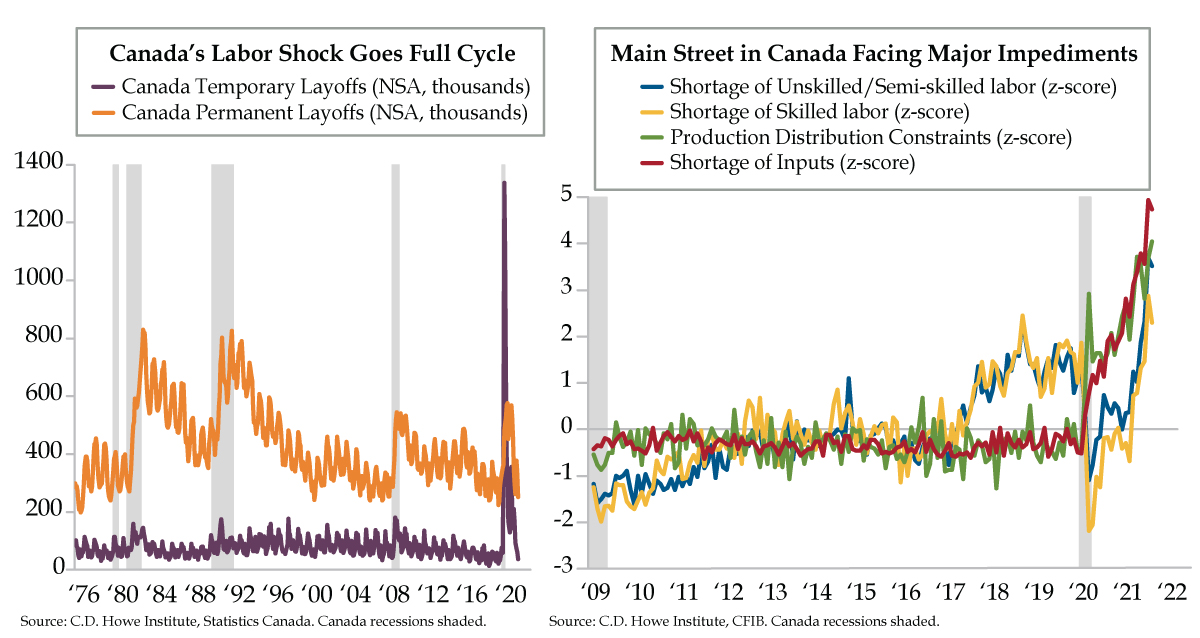
  2. Unlike in the U.S., Canada’s labor shock appears to have gone a full cycle, with both temporary layoffs and permanent job losers seeing a recovery; labor force participation has returned to 65.5%, and the labor progress made has led the BoC to taper three times already
  3. Per the CFIB, in the six months through September small business’ average price plans over the next year have run north of 3%; at present, CPI trim and CPI median are both above the BoC’s 2% target at 3.3% and 2.6%, respectively, risking cost pressures flowing downstream
10.11.21-production.distribution

Paging the Phillips Curve

QI TAKEAWAY —  Despite a disappointing payroll headline, bullish unemployment trends should force a November taper announcement. Zooming out, the acceleration in wage pressures in the production and distribution chain could be heralding an inflation regime shift. In the near term, a steepener trade would capture that risk.

10.11.21-production.distribution

  1. The unemployed have fallen by 1.8 million in the last three months, a decline that compares solely to 2020’s post-pandemic reopening; permanent job losers are down by 936,000 and account for more than half the improvement, a confidence vote for a sustainable expansion
  2. While September’s gain of 194,000 jobs disappointed, education headcounts fell while total private employment rose by 317,000; though 4.8 million jobs remain to be recovered, the yield curve steepened, signaling the Fed should be on track to launch its taper in November
  3. Wages for production/distribution workers have seen an 8.4% annualized gain in the six months ended September, the highest since the early 1980s; small businesses are also feeling pressure, per Paychex, seeing three-month annualized gains between 5.2% and 5.4%

Payrolls Should Pop. That Won’t Be Welcomed by Powell

QI TAKEAWAY —  The cheaper volatility is, the more you should load up on it. The debt ceiling is anything but “resolved” and the Fed is backed into its tightest corner ever as it’s not traditionally eased or tightened if either could be construed as playing politics.

  1. Mitch McConnell has agreed to go along with raising the debt ceiling by $480 million, keeping things open through early December; while this gives time for Democrats to raise it again through reconciliation, negotiations between party factions remain a roadblock
  2. Challenger’s Hiring-Layoff announcement spread remains robust, and the series’ correlation with nonfarm payrolls suggests a September gain near the consensus 500,000; however, strength could put added pressure on Powell at his November presser to announce tapering
  3. Per Burning Glass, nationwide job postings have slipped into negative territory vs. January 2020 levels for the first time in three months; meanwhile, job postings requiring “Minimal Education” are up just 6.5%, the lowest print since February and well off May’s 68.2% peak


The World is Not Ending Today

QI TAKEAWAY —  ADP beat all but one forecast in the Bloomberg survey. This should keep the Fed on track for a November taper and a curve flattening in play. The curve ball is the GOP’s détente suggestion that the debt ceiling be resolved next month via reconciliation; the “gift” of the extra month diffuses Democrats claims that they don’t have adequate time to increase the debt ceiling along party lines by the ‘X’ date of October 18th.

  1. Since April 2020, roughly 40% of job gains have come from leisure & hospitality, per ADP, well above the 20% average from 2010-2019; meanwhile, non-leisure has underperformed in the post-pandemic environment, seeing just 60% of job gains vs. 80% in the decade prior
  2. ADP’s September payroll report saw a gain of 568,000, well above August’s initially reported 330,000; sectors underperforming headline growth included professional services and trade/transportation while manufacturing, education, and healthcare outperformed
  3. Since 2006, ADP Aggregate Hours Worked have had correlations of 0.9 and 0.88 to real GDP growth and real GDI growth, respectively; assuming the workweek is unchanged at 34.7 hours from August, ADP suggests a 4% QoQ annualized rate of expansion in Q3

Higher Leverage Risks

QI TAKEAWAY —  Mismatches between workers and bulging backlogs herald increasing wage pressures at a time when the economy is faced with a stall in private demand. Leverage is the answer in cyclicals most exposed to these cross currents. Active credit investors should be mindful of these factors that suggest a more bearish setting regarding valuation.

  1. Over the last week, IHS Markit has lowered its Q3 GDP estimate (as has the Atlanta Fed), from 3.6% to 1.5%, a far cry from Bloomberg’s 5.0%; driving the downgrade is a stall in private demand, which is working against increasing government spending and inventories
  2. In both the manufacturing and services sectors, the Backlog-Employment Spread, per IHS Markit, is at a historically high z-score; although both are likely to continue seeing wage pressures, the issue is most acute in manufacturing, a function of its innate cyclical nature
  3. The National Association of Credit Management found more firms expanding their credit lines in September in order to stockpile and address supply chain stability concerns; though higher leverage may be needed to weather higher costs, it also creates added right-tail risks

As Energy Crisis Spreads, Go Long Vol

QI Takeaway —  Echoes of the 1970s are filtering through the industrial supply chain. Lead times for inputs were last longer in 1974. Oil price inflation persistence for another month could change the narrative. A long volatility position might be a prudent hedge.

  1. Per ISM, September’s 92-day average lead time for production materials was the highest since October 1974; deliveries also slowed after three months of progress, with more than 50% of respondents reporting slower deliveries for just the seventh time since the mid-1970s
  2. Crude oil spot prices have seen YoY gains of more than 60% for the last eight months, echoing the run-up to the 2008 financial crisis; should persistence extend to nine months, the comparison to 1974, which saw 12 months north of 60% YoY gains, will be more relevant
  3. Bad News Heard: Energy Crisis has barely registered in recent years of UMich’s Survey of Consumers; while Google searches for “energy crisis” in the U.S. were at a 19 out of 100 in October, worldwide interest hit 100, a sign that an energy crisis is underpriced here at home

Real Consumption and Nominal Nonresidential Construction Flatline

QI Takeaway –  GOP Minority Leader Senate Mitch McConnell is just getting warmed up as he smells blood in the water in a splintering Democratic party. With the continued signs that the global economic rebound could be brought to its knees with an energy crisis, there’s no reason to own the steepening though rent it if you’ve got excellent reflexes.

  1. At a seasonally adjusted annualized rate of $787 billion, residential construction in August hit its highest print since at least 1993; while housing prices rose 23% YoY to a median $342,350 in July, per the Atlanta Fed, median incomes of $67,031 are up just 3% YoY
  2. Nonresidential construction has fallen for three consecutive months, from a $460 billion SAAR in May to $456 billion in August; similarly, the Dodge Construction Momentum Index also fell for a third straight month in August as nonresidential demand remains weak
  3. Though August’s consumer spending rose 0.8% MoM, this gain was offset by both inflation and the 0.4% downward revision to July’s -0.1% print; meanwhile, the savings rate fell to 9.4% in August from July’s 10.1% as inflation drives the increase in nominal spending
10.1.21-chicago-pmi.jobless

Job Openings Filling Even as Jobs May Have Fallen in September

QI Takeaway  — Fiscal dysfunction clearly disagrees with the markets, especially as the clock ticks on the U.S. government’s checking account hitting overdraft in 17 days. Markets have yet to fully price in the risk of a Fitch or Moody’s downgrade suggesting upside in volatility.

10.1.21-chicago-pmi.jobless

  1. Though the child tax credit has boosted spending through a $550 monthly boost, BofA credit card data suggests the unemployed cohort is pulling back; though a backlog is likely keeping PUA claims elevated, the cohort has nearly vanished from their May peak of 1.35 million
  2. Weekly initial state jobless claims have now risen for three straight weeks, a streak not seen since April 2020; a model from the St. Louis Fed using data from Homebase suggests that hiring could’ve been negative in September, with a seasonally adjusted decline of 810,000
  3. Per ISM, the Chicago PMI saw Backlogs decline in September while its Employment Index rose; the Backlog-Employment spread is now down from August’s record high of 30.8 to a five-month low of 13.1, an encouraging sign that the labor shortage is starting to see relief

Home Improvement Continues to Improve

QI Takeaway  —  The Fed’s QE has underpinned the home improvement sector. After COVID-19, this corner of residential real estate swelled to a record share of GDP – and it probably won’t stop there. Home price appreciation in high rent districts have underwritten the expansion, and top-end households have benefitted the most allowing for a sustained renovation cycle.


  1. From zero in 2008, the Fed has expanded its holdings of mortgage-backed securities to $2.54 trillion in September 2021; the Fed’s MBS holdings are tethered to housing proxy Sherwin-Williams, which has seen its stock price double since expanded QE began in March 2020
  2. The average mortgage loan size for adjustable-rate mortgages totaled $977,400 in September, $661,000 higher than the $316,400 for fixed-rate mortgages; this spread was roughly $200,000 in 2008 before QE began and higher-priced homes saw faster price appreciation
  3. As a share of GDP, home improvements have hit record highs of 1.4-1.5% post-pandemic, exceeding the 1.3% not surpassed since the series’ inception in 1959; multi-generational households have become more common as would-be new buyers have been priced out

Double Dip Risks Rising

QI Takeaway  — Key cyclical leading indicators have departed from their traditional roles. Stagflation risk is the prime suspect. But it’s not oil that’s driving inflation expectations. Broader price pressures are weighing on demand which continues to make the case for Staples and against Discretionary.


  1. QI’s Future Inventories proxy, a composite of regional Fed surveys, at 14.2 in September, was nearly 10-times last decade’s average of 1.4; however, their correlation with ISM Mfg New Orders appears to have broken, with readings diverging over the last seven months
  2. At 86.6 in September, Conference Board’s Consumer Expectations Index rivals the depths of the COVID recession, with a read of 0.0 as a z-score; after seeing a full recovery to 111.9 in March vs. February 2020’s 108.1 print, consumers are curtailing spending for large durables
  3. 12-month inflation expectations have printed north of 6% every month this year, with the latest readings north of 2 as z-scores; though these expectations have trended with oil prices in the past, WTI’s recent spike to $75 has not been the driver of consumer pessimism