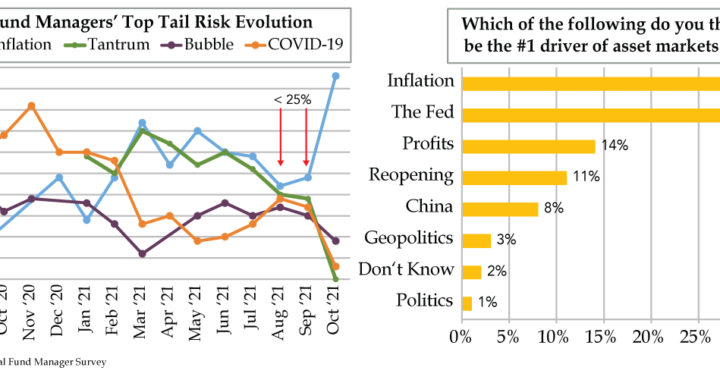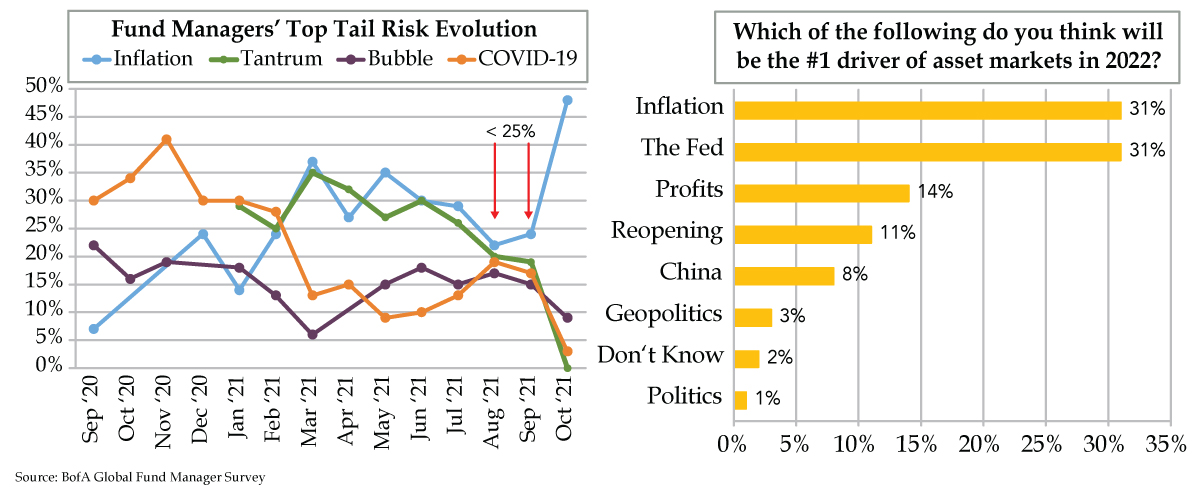
QI TAKEAWAY — The disconnect between ex-energy commodities, the dollar and the real global economy is becoming more apparent as signs of a spreading slowdown proliferate. The lack of Fed tools to address stagflation should cap long-maturity rates as policy errors, plural, get priced into risky asset prices.
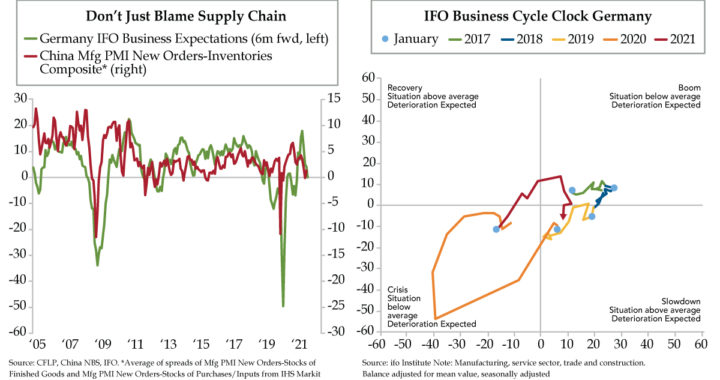
- Per the ifo Institute, at -4.6 points, German business expectations were decidedly below trend in October after running an above average 13.4 points in June; the 18-point swing in 4 months has historical comparisons only to the pandemic’s onset and Great Financial Crisis
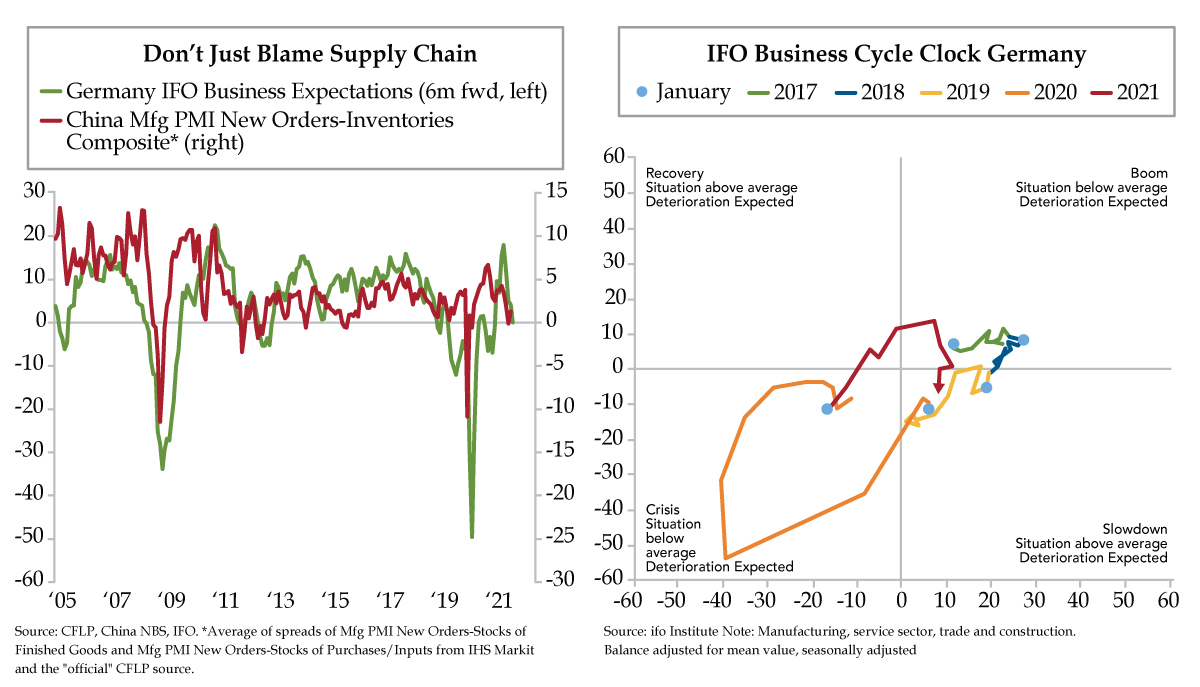
- ifo’s Business Cycle Clock, which tracks German business conditions and expectations, was in the “slowdown” quadrant for a second straight month in October; this is the first year that has seen all four quadrants traversed on account of the pandemic’s cycle hyper-compression
- China’s manufacturing New Orders-Inventories spread has slowed, helping temper German business expectations; a continued slowdown in activity could lead ECB policymakers to turn dovish just as the Fed begins its tapering efforts, piling onto euro bearishness