A Labor of Locks

VIPs

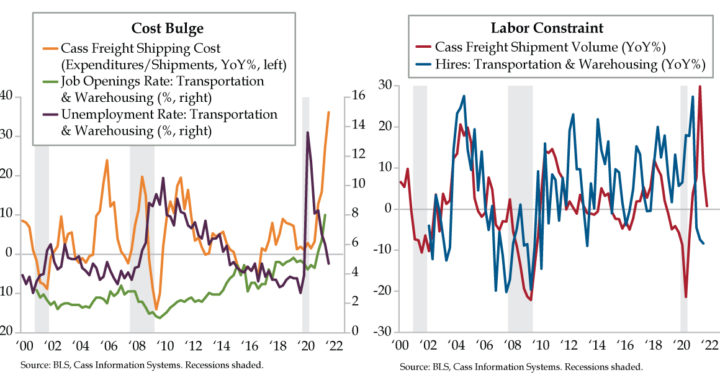
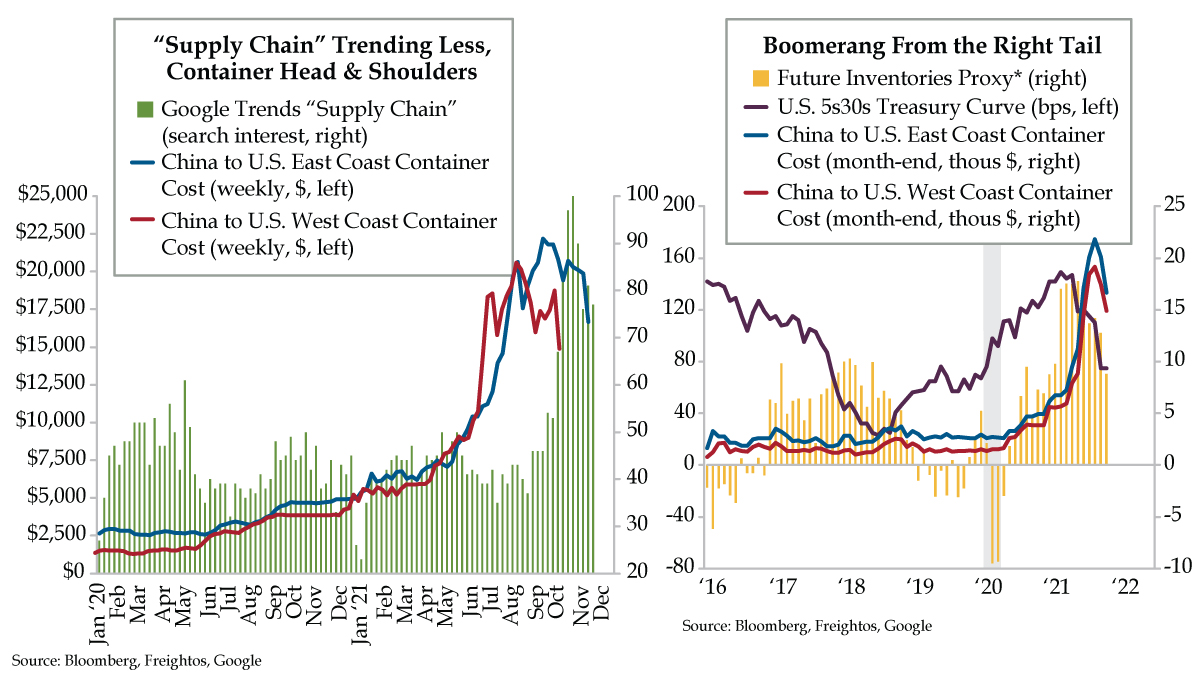
  • Bankruptcy filings for companies with at least $50 million in debt hit three in the week ended November 12 vs. nearly 15 seen in June 2020; though the Fed’s credit backstop limited creative destruction, corroded supply chains are pressuring firms that survived the pandemic
  • An average of Future Inventories from regional Fed surveys suggests that panic buying by firms has subsided; the same message, which harms future GDP math, can be seen in the tightening of the 5s/30s curve corroborated by a decline in Google “Supply Chain” searches
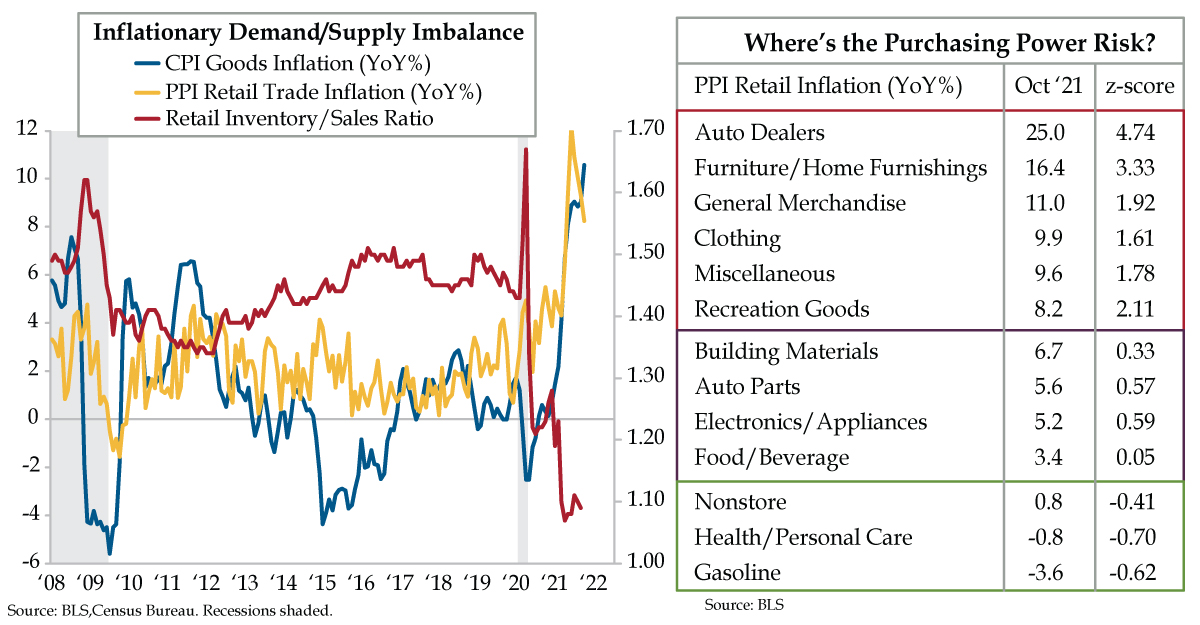
  • Per Freightos, container costs from China to the US’s East and West Coasts have finally begun to turn; should the downward trend continue, prices may begin to fall back down to Earth for consumers as well as for businesses struggling to manage elevated input costs


We all managed (our sanity) throughout the 2020 lockdown differently. My mom, who turns 75 this Sunday (Happy Early Birthday, Nana!), was a Type 2 Diabetic when the pandemic hit Cross, a Texas town so small you can’t find it on a map. There, she gardens outside her home on a small ranch I gifted her in my early 30s when I was on Wall Street (an oil company later fracked underneath the property, so it’s a gift that returns monthly royalties). While she took comorbidity seriously enough to shed diabetes, one pound at a time, she isolated in Iola until her second vaccination. With all that time on her hands, and unable to “go to town” in College Station to her hairdresser, she performed a labor of love – she grew her hair. When she emerged from her cocoon in the countryside, she donated 13 inches to Locks of Love (LOL), a nonprofit dedicated to helping children and young adults up to the age of 21 who have lost their hair as the result of cancer, severe burns or alopecia, a condition which manifests in hair loss and is age agnostic. Per LOL, due to the media’s embrace, its locks have reached thousands across “all 50 states and Canada.”

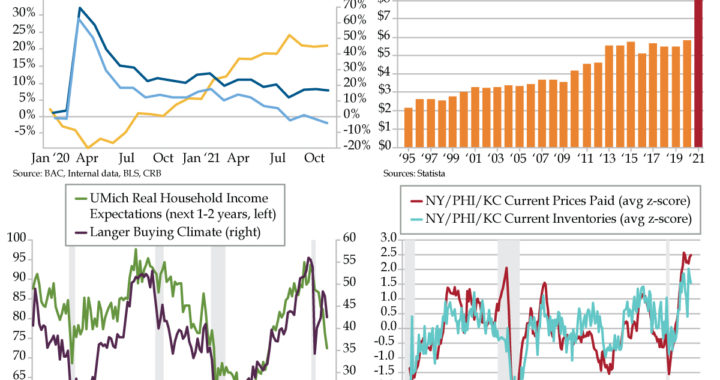
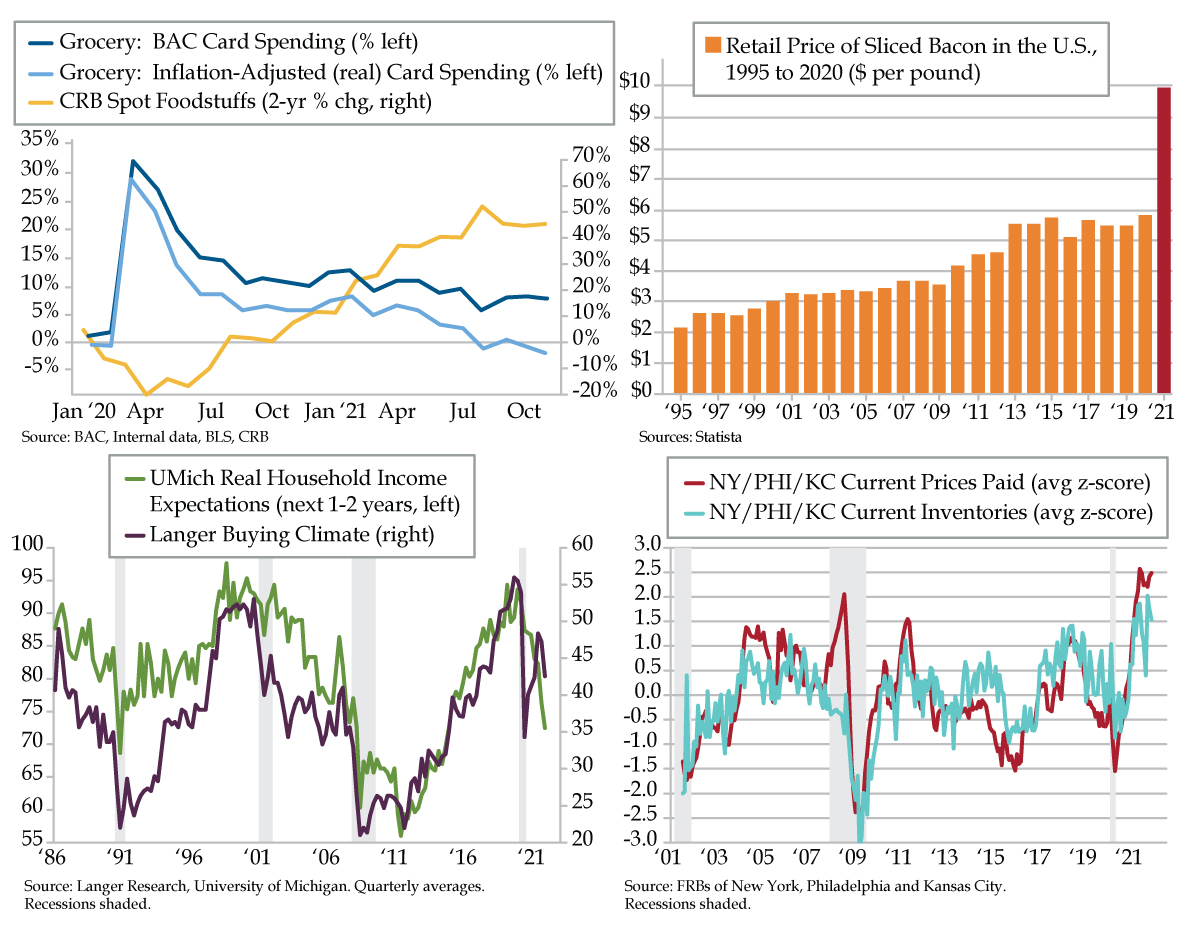
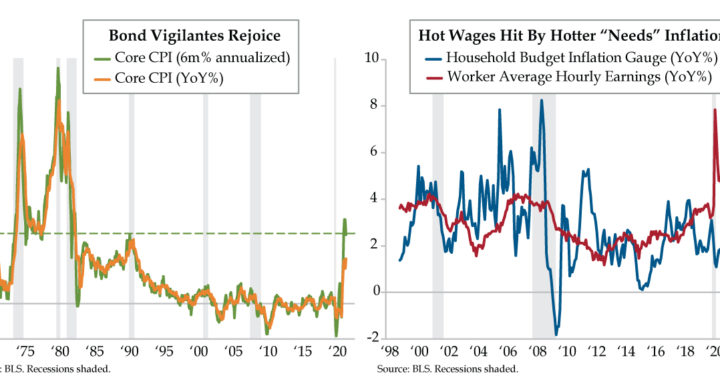
As a former central banker, I approach this Thanksgiving with utter humility and a sad sense of helplessness about the inflation my former employer has amplified by turbo-charging cruel fiscal largesse. You know I’ve been on a bacon shunning bandwagon, disgusted as I am by its in-your-face gaudy prices. Upon the occasion of visiting a Tom Thumb, a big Dallas grocery in the Safeway brand – I ended up in front of the bacon, chatting with the loveliest woman. We were both just staring at the prices. The best that can be said is that competitor, Kroger’s charges 50-cents more for a pound of Oscar Meyer; it was “only” $9.49 a pound at Tom Thumb. Her eyes full of sparkle, she said, “You know, I was talking to a friend of mine a few days ago. We said to each other, ‘Pretty soon, the only thing you’ll be able to walk out of Tom Thumb with, if you walk in with $10, is a half-gallon of milk.’” We chuckled at the truth of the matter, and I wished her a Happy Thanksgiving, and she me, as we pushed our carts past one another to move to the next source of sticker shock. But the brief exchange left me embarrassed to have dedicated nine years of my career to working for the same Fed that’s hurting such a large percentage of the American public. Powell et al have backed themselves into such a tight corner that they’re damned if they do and damned if they don’t tighten. Lower for longer had never failed them…until now.

Today’s duo of charts hints at relief on the inflation front. In the “there’s no such thing as a free lunch” department, the graphs also suggest the demand side is cooling as pressure on the supply side begins to abate. The inspiration for the depictions du jour was a lonely Bloomberg headline from last Friday: “Default Threatens Companies Reeling from Frayed Supply Chains.” Default? Didn’t the Fed outlaw creative destruction on March 23, 2020?

For those of you unfamiliar with the term, in 1942, Joseph Schumpeter introduced the world to the idea of a “gale of creative destruction” unleashed by capitalistic forces which threatened the world Karl Marx idealized. The “process of industrial mutation that continuously revolutionizes the economic structure from within, incessantly destroying the old one, incessantly creating the new one” ensures fresh, fertile ground is laid such that there are more jobs created by new entrants vis-à-vis the now bankrupt entities.

In his quest to kill capitalism, with grit equal to George C. Patton, one Jerome Powell spearheaded Operation Kill Creative Destruction in March 2020. It worked. At its apex in June 2020, weekly bankruptcy filings by companies with at least $50 million in debt neared 15. In the week ended November 12, 2021, weekly filings had fallen to three, following a muted trend that’s emerged since last September. Creative Destruction appears to have been destroyed via fiscal and monetary stimulus joining forces.

Per Bloomberg, however, “A growing cohort of smaller companies that survived the cold depths of the pandemic say now they’re in danger because the economy is too hot. Mattress sellers, flooring manufacturers and makers of clean energy equipment are warning that stretched supply chains
and runaway freight bills have pushed them to the brink of ruin.”

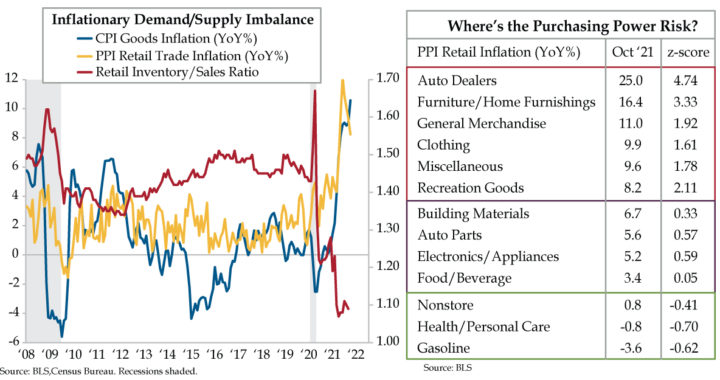
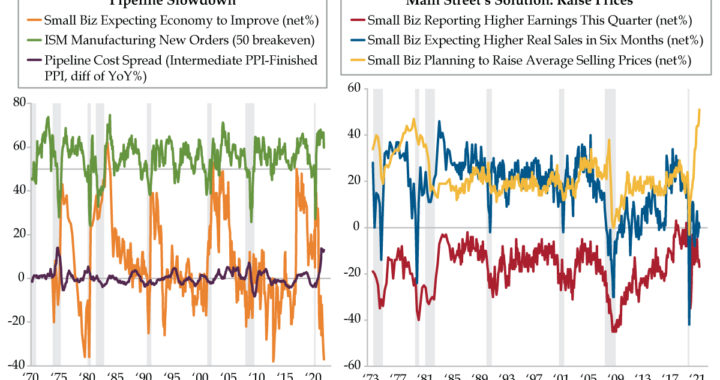
The funny thing that happens when inflation becomes so debilitating it starts to put companies into bankruptcy is that it starts to fix itself. Companies are also telling us they’ve begun to replenish their depleted stocks. An aggregate of Future Inventories gauged from the regional Fed manufacturing surveys (yellow bars) tells us the panic buying has subsided. That same message, which negatively harms future GDP math, is being broadcast by the spread between the yields of the 5- and 30-year Treasuries (purple line). Validating this soft data is the lessening in Google Trend searches for “Supply Chain” (green bars).

Though the March 1st Texas primaries are technically three months away, incumbents are already on the stump. Carping about debilitating inflation will thus prevent the good news in the red and blue lines from being well broadcast – that freight costs have finally begun to turn. We can only pray that lower prices swiftly follow for the most vulnerable the Fed has left behind.


Please join Quill Intelligence this holiday season by giving to your local food bank, church or charitable organization that directly helps the needy in the next month.


Danger, Will Robinson!

VIPs

  • Per Bank of America, the percentage change in inflation-adjusted grocery spending on a 2-year basis slipped further into contraction in October; while food inflation appears to be leveling off at high levels, per the CRB, higher prices are driving nominal gains in card spend
  • On an inflation-adjusted basis, growth in goods spending reached a massive 40% last spring, while a third stimulus check helped boost services spending 20%; against the current pricing backdrop, UMich Real Household Income Expectations in 1-2 years are now at 5-year lows
  • The aggregate of Current Inventories from the NY, PHL, and KC Fed’s manufacturing surveys, as a z-score, is just below a 20-year high; meanwhile, Current Prices Paid continue to push upward as demand pulled forward exacerbates ongoing supply chain challenges


The date more than 30 years into the future was October 16, 1997. The United States was in it to win it – the Space Race, that is. The means by which to launch this effort was the Jupiter 2, a saucer-spaced spacecraft that was to transport a cryogenically frozen family on a 5 1/2 year journey to colonize an earth-like planet orbiting the star Alpha Centauri. Such was the space craze that captured the imagination of a nation in the early 1960s Sputnik era. What started with the 1812 novel Swiss Family Robinson and inspired the comic Space Family Robinson culminated in the CBS science fiction TV series Lost in Space that ran all of 83 episodes in the three years through 1968. The original intention was to dramatically depict the trials and triumphs of a family whose spaceship had been thrown off course landing them on the wrong planet at the wrong time. The devolution to satirically silly was swift as the evil and hapless character of Dr. Smith endlessly battled the equally distracting Robot, a pricey cast addition who flailed ceaselessly shouting, “Warning, Warning!” into a vacuum bereft of cataclysms. The one catchphrase that withstood the test of time, however, was “Danger, Will Robinson!”

The markets’ Robot is the bond market, warning for months of danger, which like the SciFi icon, has fallen on deaf ears. The Federal Reserve’s slowly sapping liquidity from the markets presents nary a threat to a stock market that only knows how to mount fresh heights. Chicago Fed President Charles Evans on Thursday further reinforced the sanguinity, assuring investors that he still saw 2023 as appropriate timing for the first rate hike (we’ll be able to easily identify one of the outliers on that December dot plot revealed in this year’s last Summary of Economic Projections).

If only he’d accept, I’d invite Charlie to join me down Dallas way for my next shopping run to Kroger’s. Perhaps then he’d have a better feel for what that upper righthand chart represents. It’s hard to describe the shock effect of squinting to see if the price was a typo when I went to grab a pound of Oscar Meyer bacon priced at $9.99, up a big smidge from 2020’s $5.83. Suffice it to say, I demurred. I did not bring home the bacon, not for that price.

The cost to put food on the table has become so prohibitively expensive that when adjusted for inflation, the percentage change in grocery spending (light blue line) on a 2-year basis slipped further into contraction in October, according to Bank of America. The best that can be said is that, in the same timeframe, food inflation (yellow line) appears to have leveled off, albeit at ridiculously high levels. The sell-side firm diplomatically noted that, “With rapidly rising inflation in the economy, we have to consider how much of the gain in card spending simply reflects higher prices.” A similarly depressed trend in real spending on furniture has emerged, while airfares are bucking the trend, seeing rising real spending.

Another report released Thursday by the Economic Cycle Research Institute further warned that, “Inflation is really cutting into consumer budgets. Consumer spending intentions for vehicles and appliances are now the worst in over 40 years. Let’s not pretend that won’t weigh on real holiday spending, adjusted for inflation.”

Some of what we’re witnessing is payback for the most ill-conceived fiscal policy in U.S. history. On an inflation-adjusted basis, growth in goods rose by a blistering 40% when it peaked last spring. Stimulus check 3.0 direct deposited into checking accounts of millions of Americans who didn’t need the money similarly stoked services spending, which skipped up by 20%.

As for those who protest the nasty pullback since then, the ECRI offered up two clarifiers: “While some may wonder if this is simply about base effects, it is not. We have ways to strip out the base effect, and the slowdown patterns shown still hold.” Moreover, while “Retail sales data is much narrower [than broad] consumer spending data. Yes, real retail sales growth showed a slight uptick in October, but the downtrend that began in the spring is very much intact.”

The upshot: The slowdown in consumption ain’t near over just yet. 

The demand pulled forward is still wreaking havoc on the supply chain the dash to relief-spend catalyzed. Today’s lower right chart depicts the aggregate of the manufacturing surveys of the New York, Philadelphia and Kansas City Feds’ Current Prices Paid and Current Inventories series (turquoise and red lines). When playing-field-leveled using our favored z-scores – deviation from the mean adjusted for volatility – you see that inventories are just off their 20-year highs while price pressures have yet to abate. Both gauges remain near record highs.

Even as profit margins remain pressured, Americans’ perceptions of their wherewithal to pay up is withering. Real Household Income Expectations in the next 1-2 years (green line), as surveyed by the University of Michigan, are at five-year lows. Little wonder that the Buying Climate (purple line) reported weekly in the Langer Consumer Comfort Index has also hooked back down.

Hopes are running high that a week from today, Black Friday will be one for the record books as U.S. consumers are compelled to buy early, or else. The risk is that the Robot that cried wolf is finally flagging a true warning.

Hysteron Proteron Club


VIPs

  • New homes under construction rose to 1.451 million in October, eclipsing the 2000s peatilk of 1.426 million circa March 2006; the last time units under construction were higher was the 1970s, though the current boom critically lacks the same underlying population growth rates
  • Unsold existing single-family home inventories sit at 2.4-months, a record low with no prior reading below 3 in data back to 1982; meanwhile, the undersupply of new single-family homes in 2020 has given way to prints closer to the long-term average of 6 months in 2021
  • A record 28% of new single-family homes for sale are “Not Started” – a massive backlog of unbuilt homes; however, with buying conditions, per University of Michigan, inverted for the first time since the 1980s, demand will be challenged by the high pricing environment


“Life is short; eat dessert first” is a familiar mantra attributed to famed pastry chef Jacques Torres. But he wasn’t the first to suggest such turnabout in the daily ingesting process. That idea was championed by the Hysteron Proteron Club, a 1920s dining club at Balliol College, Oxford in England. The club’s name, of Greek origin, is a hysteron proteron – a rhetorical turn, which occurs when the first key word refers to something that happens later than the second. An example in everyday life would be “putting on your shoes and socks,” rather than taking the logical reverse route. At Balliol College, the Hysteron Proteron Club’s raison d’etre was eating meals, but backwards. For every term, there was at least one dinner that commenced with coffee and liqueurs and ended with the soup course. The Club’s activities ventured beyond flipping eating orders. As legend holds, one meal spanned 12 hours, from 9:00 a.m. to 9:00 p.m., starting with coffee and ending with a swim, usually a pre-breakfast activity, at Parsons’ Pleasure in Oxford’s University Parks.

History of unusual English eating clubs can be summed up in more common figures of speech such as “putting the cart before the horse” or “the tail wagging the dog” or, one of QI’s favorites, “getting over your skis.” As for the here and now, no references to another Englishman, ski-jumper and Olympian Eddie are apropos. Today, we reference the risk of overbuilding in the U.S. housing market.

Cue yesterday’s October housing starts and building permits report from the Census Bureau. Most of the focus from the Street is usually on the housing starts angle as it feeds directly into residential investment in the gross domestic product (GDP). Lags for housing starts are spread out over twelve months, with most of the new home building occurring in the first nine months. This means the latest reading on starts has ripple effects on future new residential construction activity.

Many rely on the National Association of Home Builders sentiment index for guidance on the near-term path for the single-family housing sector. However, this is of the ‘soft data’ variety. The short-run direction for home building of the ‘hard data’ class comes from building permits. This metric is a varsity leading indicator, one of ten to make the cut on the team of the U.S. index of leading economic indicators.

One measure from the starts/permits report that’s overlooked, however, is that of homes under construction. This indicator provides a snapshot of present activity that’s been permitted and started but not yet finished. ‘Under construction’ is one of the stages of housing production, with ‘Not started’ coming before and ‘Completed’ coming after.

Quietly and to little fanfare, new homes under construction in the U.S. rose to 1.451 million in October (blue line). Follow the dashed blue line from right to left and observe how the post-COVID boom in home building has now eclipsed the 2000s peak of 1.423 million reached in February and March of 2006. A further glance to the left lands the dashed line against the only other bulge rivaling the current one – that of the early 1970s.

Before you think of asking – YES, the 2021 run-up in house prices does resemble this era…sans the underlying demographic justification. Faster home price appreciation translates to higher margins and profits for home sellers. Home builders are incentivized to sail downwind and build more units to ‘answer’ the pricing environment. To that end, the average sales price for new single-family homes is roughly 14% above year-ago levels (yellow line) through the first nine months of 2021. Follow the yellow dashed line to the left from the latest plot and you’ll also land in familiar territory – the 1970s boom.

Housing undersupply has become a battle cry of the realtor community, prompting the builder community to ultimately capitulate. At the current sales pace, unsold existing single-family home inventories sit at a 2.4-month supply (green line). At no point in pre-pandemic history, back to 1982, did single-family existing home supply register readings below 3 months.

The extended undersupply signals emanating from the home resale market have builders hungry to satisfy home buyers’ needs. At 3.5 months, record undersupply of new homes in 2020 (red line) have given way to readings closer to the long-run average of about 6 months (dashed red line) in 2021. But that doesn’t mean this is the new status quo.

A record 28% of new single-family homes for sale are in the stage-of-production bucket that’s furthest upstream, as in not started. In short, it translates to land acquired. Think of that as a proxy for the backlog of yet-to-be-built homes. These properties require prepping such as grading and laying infrastructure like sewer lines, etc. Once that process is complete, the builders can (and, critically, must) go vertical. There’s a unique inertia to finish the projects once they’re started.

Echoes of 1970s home price inflation and home building bulges don’t necessarily sound like the overbuilding of the 2000s. With home buying conditions inverted (more saying it’s a bad time to buy than good) for the first time since the early 1980s, demand for new shelter will be challenged by a persistently high pricing environment. The vulnerability of getting way over their skis could become nastily manifest as builder momentum leads to new home months’ supply running noticeably above the long-run trend. Better to eat dessert first.

King of the Catch Phrase

VIPs

  • October’s 1.7% MoM retail sales print was the largest since March and more than four times greater than the 0.4% long-term average; however, given these are nominal terms, deflating them using the CPI shows real retail sales remain 6% below March’s post-pandemic high
  • At 1.09, September’s retail inventory/sales ratio hovered just above April 2021’s record low 1.07 print; prior to the pandemic, this metric had never fallen below 1.3, with fiscal stimulus helping to drive a persistent supply/demand imbalance and pull forward consumer spending
  • PPI retail trade inflation, though off its June peak of 12.2% YoY, remained high in October at 8.2%; as z-scores, retail inflation is rising at above-trend rates in six sectors, notably autos, furnishings, general merchandise, clothing, miscellaneous goods, and recreation goods


Daniel Pugh was born in Zanesville, Ohio and raised in Mason, about 30 minutes north of Cincinnati. One of six children, he played basketball at William Mason High School and leveraged his court skills to a basketball scholarship at Eastern Kentucky University where he majored in communications. After college, he was an on-air radio personality at WTUE in Dayton from 1979-83 and moved on to CNN as a sports reporter from 1983-89. His big break came at ESPN, when he dropped his surname for his middle name ‘Patrick.’ The rest, as they oft say, is history. Fans of ESPN’s SportsCenter remember Dan Patrick’s pairing with Keith Olbermann, which elevated the program to star status. But it was Patrick’s catch phrases that are the stuff of legend. Who can forget “The WHIIIFFFF!” or “NOTHING but the bottom of the net!” or “We’re going to ooooovertime” or “You can’t stop him, you can only hope to contain him”?

Pugh’s indelible imprint on popular sports culture propted Sports Illustrated to create a dictionary of Dan Patrick’s terminology. Probably the most memorable and recognizable utterances was, “(Dare I say) En fuego.” This reference translates smoothly to yesterday’s U.S. economic calendar. October retail sales were en fuego. The 1.7% headline gain that includes food services bested the 1.4% consensus estimate, and was not only the largest monthly increase since the stimulus-juiced month of March 2021 (up 11.3% month-over-month), but was more than four times greater than the long-run average run rate (0.4% per month). This marked the third straight gain, and the longest winning streak for retail spending in about a year.

The good news prompted the Street to upgrade fourth-quarter consumer spending forecasts, especially with “control group” retail sales, the direct input into personal consumption, starting off the autumn quarter nearly 12% (annualized) above the third quarter average, following a 3.2% quarter-over-quarter annualized advance in 2021’s third quarter.

To say that retail sales were inflated is an understatement. Recall, the Census Bureau reports the data in nominal dollar terms; they are a product of price * quantity. The purer retail sales series that excludes food services ring-fences goods spending. Through this lens, nominal retail sales reached a record high in October, eclipsing the April 2021 level by 0.6%. Never more dollars in the cash register. Cha-ching!

Volume matters. However, when deflating these figures by the consumer price index (CPI) for goods, October real retail sales stood 6.0% below the March post-pandemic high point. Looking at the retail space from this angle flags significant ground to recover in this phase of a normalization after the last of the stimulus checks produced the bulge in spending earlier this year.

For perspective, CPI goods inflation rose to a 10.5% year-over-year (YoY) rate in October (blue line) a level last seen in the inflation mountain ranges of the 1970s and early 1980s. (An aside – it’s remarkable that President Jimmy Carter is alive to witness this phenomenon. One can only imagine what he thinks of “transitory”!)) Alternatively, the producer price index (PPI) has a similar measure from the retailers’ perspective. The PPI for retail trade inflation also has accelerated in tandem with the CPI measure, reaching double-digit territory – and a 12.2% YoY peak in June – before ebbing to a still high 8.2% in October (yellow line).

These parallel lines are the byproduct of the demand/supply imbalance in the retail sector. Yesterday’s U.S. business inventories report revealed that at 1.09, September’s retail inventory/sales ratio remained awfully close to April 2021’s record low of 1.07 (red line). The history of the series is critical to this discussion — prior to COVID-19, the retail inventory/sales ratio never fell below 1.30. Stimulus on steroids – 42.3% of GDP directly deposited into the checking accounts of millions who didn’t need the money — helped drive excess demand that fueled the persistence of the undersupply, which then drove the two legs down to record lows.

Pervasive retail undersupply. Note that low inventory/sales ratios spread far beyond the auto sector. Home goods, such as furniture and home furnishings; electronics and appliances; building materials; food and beverages; clothing and accessories; and general merchandise all face below normal supply conditions relative to the level of demand.

While prices are boosting top-line retail sales, stubbornly high and rising prices could act as a governor on future spending through hits to consumer purchasing power. The table above illustrates this by delving into the granularity in the PPI data.

Retail inflation in six categories color coded in red – autos, furniture/home furnishings, general merchandise, clothing, miscellaneous goods and recreation goods – is expanding at above-normal rates. This is depicted in the far-right column using z-scores, deviations from the mean adjusted for volatility. Those colored purple – building materials, auto parts, electronics/appliances and food and beverages – indicate inflation closer to normal rates. And the three in the green zone – nonstore (i.e., ecommerce), health and personal care, and gasoline – all sport price trends running at below-normal rates.

Dan Patrick should narrate the rest. Does diminishing purchasing power risk “Goodbye…Game over…Drive home safely” for the U.S. consumer? “Gone” is not how you would prefer to see your unrealized portfolio profits. Those long in the consumer discretionary sector might be wise to be “going against the grain” and pare positions. Remember “defense wins championships” and persistent purchasing power headwinds suggest performance in more cyclical spaces in retail could face more challenges. “Alongside my tag team partner, I’m merely Dan Patrick.”

Not Archimedes Principle


VIPs

  • Cass freight shipping costs saw a 36.2% YoY gain in October, the largest on record, as supply chain disruptions persist; though logistics costs have surged, shipment volume has calmed thus far in Q4 to a 0.8% YoY advance vs. the 29.9% and 9.1% gains of Q2 and Q3
  • The American Trucking Association estimates that the trucker shortage will exceed 80,000 drivers by year end 2021; pandemic scarring has also exacerbated the issue, with more than 3,000 trucking companies shuttering last year, per Broughton Capital, up from 1,110 in 2019
  • September’s JOLTS saw 589,000 job openings in transportation, more than twice December 2020’s 277,000; this pushed openings to 8% of total sector employment, all while paychecks for long-distance freight trucking rose a record 11.9% YoY vs. the 2.5% long-term average


Some iconic characters in history were born to be wild. Archimedes, of Syracuse, Sicily, wasn’t just a Greek mathematician, physicist and engineer, but also an astronomer and inventor. This radical dude proved a range of geometrical theorems including the area of a circle, the surface area and volume of a sphere and the area of an ellipse. Deriving an accurate approximation of pi on his lunch break wasn’t why he’s considered to be the greatest mathematician of ancient history. Old Archimedes also anticipated modern calculus and was one of the first to apply mathematics to physics with his entrepreneurial startups of hydrostatics and statics. Image you’re the fella to prove the principle of the lever or brandish widespread use of the theory of the center of gravity. Of course, this party animal was best known for formulating the law of buoyancy, known today as Archimedes’ Principle.

Great minds discover more than the complex, they’re also renowned in the equally valued art of making for simple observations. Archimedes was credited with articulating that the shortest path between two points is a straight line. In today’s supply chain constrained world, many suffering their posts in logistics can only dream of applying this straightforward concept to securing deliveries from point A to point B.

To this end, every month since 1995, Cass Information Systems has delivered trusted data on the intra-continental North American freight market from raw materials to finished goods. All domestic modes are included with trucking carrying a heavier weight. In October, Cass freight shipping costs didn’t just reach a record high level – the 36.2% year-over-year (YoY) gain was the largest on record (orange line). This combination of expenditures divided by shipments produces inferred freight rates. As Cass expounded, “there are a lot of excess miles in the system due to all of the supply chain disruptions in the shortage economy of 2021. Chassis production improved this month but remains far from what is needed to address rail network congestion, so West Coast imports continue onto truckload, considerably raising the length of haul in the largest freight market.”

Higher freight costs are tied to more than bottlenecks across the system; driver shortages also impede the lassoing and hog-tying of delivery times. The American Trucking Association (ATA) provided a recent update at the end of October estimating that in 2021, the truck driver shortage will hit a historic high north of 80,000. ATA noted that the shortage is most acute in the longer-haul (not local) for-hire truckload market. Not helping the cause is Amazon Delivery Service Partners offering drivers more than $20 per hour plus a signing bonus of upwards of $3,000 to deliver packages to their local communities.

Permanent scarring from the pandemic also played a crucial role in aggravating the driver shortage. A total of 3,140 trucking companies ceased operations last year, according to a report from transportation industry data firm Broughton Capital, up from 1,100 in 2019. Smaller trucking companies were particularly hard hit; Broughton’s data found companies that closed last year owned an average of 16 trucks. That’s about 40% smaller than the average carrier that shuttered operations in 2019. Moreover, and not surprisingly, larger trucking operations and more well-capitalized firms better weathered the economic fallout from the pandemic vis-à-vis their smaller counterparts. Most critically, ATA adds that small trucking companies and independent owner-operators comprise the majority of the nation’s freight carriers — 91% of fleets operate with six or fewer trucks while 97% operate with 20 or fewer.

The September Job Openings and Labor Turnover Survey (JOLTS) revealed unprecedented demand for transportation workers. The record 589,000 job openings more than doubled from December 2020’s 277,000 figure. This furious run up pushed the job openings rate in the transportation and warehousing industry to 8.0% by 2021’s third quarter (green line). This occurred alongside a 6.0% unemployment rate in transportation during the summer quarter causing a near-record in the job openings-to-unemployment spread of 2 percentage points. Preliminary readings for the fourth quarter suggest 2019’s fourth-quarter widest point in openings-to-unemployment should be eclipsed as transportation unemployment fell to 4.7% in October (purple line).

The labor mismatch is one reason massive incentives are being deployed to lure more warm bodies to get behind the wheel of an articulated vehicle. Annual growth in worker paychecks (not managers) in long-distance general freight trucking hit a never-before-seen 11.9% YoY rate in September, nearly five times the longer-term average of 2.5%.

While costs have surged across the logistics space, shipment volume has downshifted to a near neutral speed so far in the fourth quarter. The quarter-to-date 0.8% YoY advance indicated a major slowdown from the second quarter’s 29.9% increase and the 9.1% gain in the third quarter (red line). Although much more volatile than the Cass shipment series, hires in the transportation sector provide a proxy for added drivers. The unmatched deficit of drivers makes it perfectly logical that the hiring picture is not positive. Transportation hiring has been in the red on an annual basis in every quarter thus far in 2021 (blue line). This losing streak was only rivaled during the Great Recession.

As brilliant as Archimedes was, we think even he would have a difficult time trying to resolve today’s supply chain challenges. While real activity is hitting stall speed, freight rates remain wildly elevated. It’s the latter – pricing, and by extension margin protection – that keeps the bull running for transportation stocks.

Greatest Expectations


VIP

  • The record 4.3 million U.S. workers who quit in September total 3.0% of total employment, a sign of increasing worker confidence; geographically, quits were highest in the South at 3.3%, and were outsized in food/accommodation and arts/entertainment at 6.6% and 5.7%
  • Though off a record high 7%, job openings still remain at an extraordinarily high 6.6% of total employment; however, per UMich’s most recent survey, Current Conditions slumped to 73.2, an August 2011 low, while Expectations slid further to 66.8, an October 2013 low
  • Buying conditions for household goods slipped to a 78 in UMich’s latest read, the lowest since 1978; and despite a record number of quits, one in four households anticipate being worse off in 12 months and the Democrat-Republican expectations divide hit a new high


“Ask no questions, and you’ll be told no lies.”

Charles Dickens
Great Expectations


The last thing you want to read in a Feather top is trite. With that as preamble, I used the quote above from Charles Dickens’ Great Expectations. It better resonated after listening to Janet Yellen and other Federal Reserve officials make their way through the Sunday Big Four TV circuit being asked softball questions, giving softball answers. The truth is, with apologies, trite is the only thing I can’t get out of my head as I take in today’s charts. Indulge me. I quote in its entirety what follows, “…the worst of times.” Dickens’ fullness best captures today’s U.S. economy: It was the best of times, it was the worst of times, it was the age of wisdom, it was the age of foolishness, it was the epoch of belief, it was the epoch of incredulity, it was the season of Light, it was the season of Darkness, it was the spring of hope, it was the winter of despair.”

Let’s start with the best of times for the record 4.3 million U.S. workers who quit in September (green line). This headline has been everywhere since Friday morning as proof of the strength and endurance of the economic recovery. There’s no doubt a 3.0% of total employment Quits rate –Yellen’s proclaimed favorite labor market barometer – at unprecedented heights speaks volumes to the unbridled job security and power over their employers’ workers in desired fields have.

The details of the Quits data are even more remarkable, which is obfuscated by the monthly delta of the 0.1% increase in the Quits rate to 3.0% between August and September. No labor economist in the industry bests QI friend Philippa Dunne when it comes to the weeds of data on employment in America. Here are the details in full that she pulled from the Quits data alone, which are key to appreciating the massive increases in certain industries and surprising declines in manufacturing, both of which I will bold:

“The Quits rate slipped in the northeast, to 2.2%, and in the Midwest, -0.2 percentage points (pps) to 3.0%, but rose a tick in the South, 3.3%, and jumped in the West, up 0.4pps to 3.1%. Sectoral detail was mixed, with quits in construction and logging & mining down 0.1pps, to 2.5% and 1.5%, durable manufacturing unchanged, but nondurables up 0.5pps to 3.5%. Quit rates in education were up, 0.5pps to 1.7% in the private sector, and 0.4pps to 1.1% at the state and local level. Other services saw a big jump from 2.3 to 3.1%, where there were unusually large gains in employment in October, led by laundry services.  After rising a full point to 6.6% in August, the quit rate held steady among food & accommodations workers but jumped from 3.2 to 5.7% among those working in arts & entertainment.Rates in wholesale trade, -0.6pps to 2.2%, and in retail trade, -0.4pps to 4.4%, fell, but rose in transportation and warehousing.”

I can vouch for the laundry services and arts and entertainment spikes. My most recent New York hotel stay included daily cleaning, all the way down to the fresh sheets daily. That uptick in services is impossible without the laundry industry getting JOLT-ed. Ditto for the two last viewings of Daniel Craig’s last Bond movie (tragedy for womankind) – the movie theater audiences in both instances have been full and the counters sending overpriced popcorn fully staffed.

We add that after peaking at 7.0% of total employment, job openings have slid to a still extraordinarily high 6.6%; the declines were led by the South and the West. Why niggle with such details when we’re contemplating an openings number north of 10 million? Take in that middle chart – we’ve grown accustomed to Expectations (blue line), tracked twice monthly, by the University of Michigan (UMich), leading the way down. What stood out in Friday’s report was Current Conditions (orange line), which played serious catch-up to Expectations and has slumped to an August 2011 low (debt ceiling showdown, anyone), and blew past (in a bad way) what consumers expect, which collapsed to an October 2013 low.

But hadn’t we concluded that it was the best of times? Some 4.3 million Americans quit their jobs in September, for God’s sake. The devil is in the details for those without employee empowerment. Or, as half-century UMich economics guru Richard Curtin rightly observed, sentiment is at a decade low due to, “escalating inflation and a growing belief among consumers that no effective policies have been developed to reduce the damage from surging inflation.”

What we are witnessing IS the best and worst of times. We’re taking in, in real time, this inequality divide writ large.

The UMich report showed buying conditions for household goods deteriorated sharply, with a gauge falling to a reading of 78, the second lowest in data back to 1978. At QI, we disdain the superficial, so Dr. Gates dug deeper and aggregated buying conditions across the three majors – homes, cars and durables (yellow line). At 63, the record low is, and remains, unprecedented. One in four households anticipate being worse off in the coming 12 months, the antithesis of the record number of Americans quitting their jobs. For good measure, the U.S. has never been this divided as a country (purple line). We despise one another, which makes it the worst of times indeed.

Walkin’ In Memphis Like an Egyptian

VIPs

  • Per CoreLogic, Memphis is the most desirable housing market for investors, with the rest of the top 10 spread across the South and Mountain-West; conversely, the least attractive housing markets for investors, save for two cities in Louisiana, are in the Northeast
  • Pre-pandemic moratorium, Memphis historically had one of the highest eviction rates of any MSA at 6.1%; this suspension of lower-end supply sent rent inflation 19% over the 2014-2020 trend-line, but as evictions resume, new supply should give a reality check to investors
  • The share of employees working from home has now fallen from 35.4% of the workforce in May 2020 to just 11.6% last month; with investors doubling down on their housing market purchases in spite of this, oversupply could soon apply pressure to an overheated market


You thought “Walkin’ in Memphis” was only possible in Tennessee. The truth is, you’d have had to first “Walk Like an Egyptian.” Memphis, Egypt is the city from which the one synonymous with Bar-B-Que derived its name. “Memphis” is the Greek adaptation of “Men-nefer,” meaning “enduring and beautiful.” In contrast to Nashville, the Memphis of the Egyptian era was the capital of ancient lower Egypt circa 3000 BC. You don’t have to travel halfway around the world, however, to visit a different Memphis. The states of Alabama, Florida, Indiana, Michigan, Missouri, Nebraska, New York and my home state of Texas boast them. With a population of 2,215, the Texas town was nameless upon its 1889 founding. As legend holds, a reverend saw a letter addressed to Memphis, Texas, to which he said, “There’s no such town in Texas.” With that, the town was christened…accidentally. Though small in population, Memphis, Texas boasts five newspapers and local TV channels and three radio stations.

Unlike the Texas town, investors have swarmed Tennessee’s Memphis. CoreLogic identified Memphis as the most desirable Metropolitan Statistical Areas (MSA) for investors. Note a pattern in the other top 10 – seven are in the South while three are in the Mountain-West. Conversely, with the exception of two Louisiana cities, the least attractive places to invest are in the Northeast. Booming economies vs. metros that have long been on life support. Fair enough.

But there’s a big however as it pertains to Memphis, and to a lesser degree Atlanta, one caught by the eagle-eyed Michael Green, QI colleague and Chief Strategist at Simplify Asset Management. As reported by Realtor.com, at 6.1%, Memphis has historically been the highest eviction market. (Atlanta ranks 3rd highest at 5.70%).

The background is key to the punchline. On March 27, 2020, the Cares Act imposed a nationwide rental eviction moratorium that expired, after multiple extensions, 18 months later, this past September 30th. Tack on another 30 days of grace – the notice that must be provided – and we’re about proceedings that started all of 12 days ago.

If we’re speaking in purely economic terms, the question is, “What does a suspension of reality produce?” In Green’s words, “When you cut off evictions, you cut off the left tail of a distribution since evictions primarily hit the lower end.” The upshot, unless you’re an investor buying into the market not aware of the dynamic, the result is that the protracted suspension sent rents in Memphis ripping off the 2014-January 2020 trend by 19%. At 10%, the effect was not nearly as pronounced in Atlanta, but it should still be a reality check for investors who’ve descended upon that MSA en masse.

While few anticipate such a development – payback is primed to be a bitch not just on the rental appreciation front, but also in housing supply, which we’ve described in detail in recent Quills as being approximately five times the 6.8 million housing supply deficit purported by the National Association of Realtors.

The Econ 101 of an unexpected overpricing and oversupply of homes conjures the concept of Owners’ Equivalent Rent (OER). To quote Wednesday’s Quill, OER is as false a proxy as could be devised – it can never reflect the S&P/Case-Shiller home price index or any other home price appreciation metric. Per the BLS: “Owner occupied units are not priced in the CPI Housing Survey.” Rather, owners are asked, “If someone were to rent your home today, how much do you think it would rent for monthly, unfurnished and without utilities?”

To add insult to CPI’s housing inflation, which is purely a hypothetical gauge of rental rates, they’re adjusted for hedonics the same way your iPhone is not more expensive than your Motorola flip phone because it does so much more than that old relic. To that end, if a given home in the six-month rotating pool of properties the BLS tracks sees a spike in this theoretical rental rate, it’s booted out under the assumption a major renovation has so improved the home to render the apples-to-apples comparison that of an apples-to-oranges, thereby disqualifying it.

The bottom line: Despite the hysteria surrounding the threat of home prices bleeding their way into the CPI in coming months, while some of the increase will filter through, reality will never be reflected in the BLS’ flawed metric.

The other reality is demurred by the media. As empowering a message as ‘Working from Home’ (WFH) is, this tony cohort has dwindled from 35.4% of the employed workforce in May 2020 to 11.6% last month. The question home investors: “Define the future into which you’re overpaying for homes to then rent out?” As you see in the upper righthand chart, the two trends are moving against one another – investors are doubling down even as WFH fades…that makes sense how?

To speak out of the other side of our mouth, there’s an undeniability to the long reach of housing at cycle outsets. Construction materials must be transported within U.S. borders or imported. The consumer picks up the baton via post-purchases. The real estate industry acts as a liaison for transactions, and the financial sector underwrites the mortgages and home insurance. Local governments then collect the property taxes. Housing is an economic conduit, which is manifest in the leading role it plays in ex-shelter inflation (bottom righthand chart). Don’t count it out, but don’t give it more credit than due given it’s been artificially propped.


Thank You for Your Service


VIPs

  • Both the MoM and YoY changes in the CPI and core CPI exceeded every estimate by economists in Bloomberg’s survey; the surprise generated an up-shift in the U.S. Treasury curve, with the greatest bulging seen at the 5-yr point as the 5s30s curve flattened < 70 bps
  • In the last five months, six-month annualized core CPI has run between 5.9% and 6.8%, not seen since the early 1980s; with this shorter-run trend running hotter than the YoY pulse, core CPI inflation forecasts are likely to be revised upward from the current 4.6% annual rate
  • QI’s Household Budget Inflation Gauge rose to a 6.4% YoY rate in October, the highest since the Great Recession; while wages for non-manager workers has risen from April’s 1.1% to 5.8% YoY in October, the HBIG has outpaced wage gains in five of the last seven months


The Declaration of Independence is the philosophical foundation of American freedom. Of course, it’s U.S. veterans who have protected these freedoms we cherish so. Veterans Day pays tribute to all who’ve honorably served in the armed forces but gives special thanks to those who are still with us. Today’s Federal holiday originated as Armistice Day on November 11, 1919, the first anniversary of the end of World War I. Major hostilities of the Great War were formally ended at the 11th hour of the 11th day of the 11th month of 1918, when the truce with Germany went into effect. Congress passed a resolution in 1926 for an annual observance and Veterans Day became a national holiday in 1938. It wasn’t until 1954 that President Dwight D. Eisenhower, one of the most decorated veterans in U.S. history, officially changed the name from Armistice Day to Veterans Day. For part of the 1970s, Veterans Day was celebrated on the fourth Monday in October. But, due to the historical significance of the date, in 1975 President Gerald Ford sagely returned the holiday to November 11.

Nowadays, references to the 1970s have inflation connotations attached to them. Yesterday’s consumer price index (CPI) clearly qualifies for that characterization, and not just because the forecasting community was caught completely offsides…again. It wasn’t so much that the month-over-month and year-over-year (YoY) changes for both the CPI and core CPI smashed through consensus estimates. It was that every estimate by every economist in Bloomberg’s survey for all four measures fell shy of the official results.

Bond vigilantes assemble! The surprise factor from the CPI generated a level-shift up in the U.S. Treasury curve as shorts were likely fleeced on the back of last week’s rally in the bond market. The bulge was greatest in the belly of the curve, at the 5-year point, generating additional flattening in the 5s30s curve under the 70-basis point mark.

Moreover, both inflation breakevens and real yields rose, the former by more than the latter. Earlier in the trading session, most of the move in nominal yields was driven by inflation expectations, as rates traders adjusted to the reality of higher inflation. Later in the session, vigilantes pushed up real yields, building in a Fed boxed tighter into a corner of its own making. To that end, Fed fund futures priced in one quarter-point hike by July 2022’s FOMC meeting and more than two by the December meeting.

Back to those 1970s references… Nothing gets bond bears more lathered up than an inflation comparison to the bell-bottom decade. As you see on the left, in the last five months, the short-run core CPI inflation trend (six-month annualized) has run between 5.9% and 6.8%. These elevated rates also prevailed in the 1970s. From the early 1980s to (what was the) present, these levels were seen as the ceiling for the short-run core trend.

This narrative will feed on itself, giving bears more ammunition. The short-run inflation trend (six-month annualized) is running above the medium-run path (year-over-year), and the latter usually converges to the former. Core CPI inflation forecasts are likely to be chased up from today’s 4.6% annual rate. And core inflation is the operational target for the Fed – it captures the underlying inflation dynamic by wiping clean those (most meaningful but volatile) food and energy prices that can be subject to supply shocks, geopolitical risks and acts of God.

Playing devil’s advocate: What if the Fed was right in letting inflation run hot? Conventional wisdom and yesterday’s bond market reaction suggest the answer is a decided ‘no’. But what if the kind of inflation that’s brewing was damaging consumer purchasing power, future consumer spending prospects and thereby endangered the Fed’s maximum inclusive employment mandate?

Many moons – Feathers – ago, we introduced the concept of the Household Budget Inflation Gauge (HBIG). Quite simply, it’s “Needs,” or nondiscretionary, inflation. Think of a typical household budget — a compilation of prices for food & beverages, energy, clothing, household supplies, housing services, utilities, health care, home/auto/health insurance, phone/TV/internet, higher education and personal care products & services.

In October, the HBIG rose to a 6.4% YoY rate, the highest since the Great Recession. Applying our favorite normalizer, the z-score (deviation from the mean adjusted for volatility), the October HBIG translated to a 2.1 on the z-scale. Of the seven other documented precedents, five were either leading up to or during the 2007-09 recession or after the massive distortions that came ashore in 2005’s Hurricane Katrina.

A high and rising HBIG is more damaging to household budgets down the income stack. Worker wage inflation from the 80% of employees that are not managers proxies and has run up from April’s 1.1% annual rate to last month’s 5.8% YoY pace; the HBIG has outpaced wages in five of those seven months, October included.

Any veteran can tell you that Needs inflation cannot be avoided. The bond market has been conditioned by the Fed to sell the upside news of upside inflation surprises. The thing is, if the HBIG was the operational inflation target, the Fed should react in opposite fashion – lean easier, not tighter. Based on last week’s signaling from Powell & Co. that it’s not “a good time to raise interest rates…because we want to see the labor market heal further,” the Fed may be inadvertently doing just that.

Banzai Pipeline

VIPs

  • PPI inflation for intermediate goods has exceeded the same metric for finished goods by a double-digit margin for the last six months; only the seven-month stretch from July 1974 to January 1975 compares historically, as pipeline pressures risk bleeding into consumer prices
  • ISM Manufacturing New Orders, though still above the 50-breakeven, has fallen below 60 after a 15-month streak north of that threshold; further declines could continue to push down Small Business Expectations, already at near record pessimism due to elevated uncertainty
  • In the NFIB October survey, a record 51% of small business owners said they plan to raise prices in order to combat higher material, transport, and labor costs; with core PCE printing at 4.4% vs. the 2% target, the latest CFO Survey also validates the rising input cost dilemma


If you harbor an obsession with the Banzai Pipeline Hawaii, known worldwide for its perfect barreling waves, head to Ehukai Beach Park on Oahu’s North Shore. Surfing pipeline is a unique experience like no other and ranks high on hardcore surfers’ bucket lists. The location’s name combines the surf break (Pipeline) with the name of the beach fronting it — Banzai. The spot is also rich in history. In December 1961, legendary surfing producer Bruce Brown was driving up to the North Shore with Californians Phil Edwards and Mike Diffenderfer. He stopped at the then-unnamed site to film Phil catching several waves. Coincidentally, on adjacent Kamehameha Highway, there was a construction project for an underground pipeline underway, prompting Mike to suggest the break be named “Pipeline.” The reference was first used in Bruce Brown’s movie Surfing Hollow Days and went on to be the name of a 1963 hit by surf music rockers The Chantays.

Those who dabble in the science of the dry know there’s a lower-case ‘pipeline,’ as in the production pipeline. Each month, the producer price index (PPI) report dives deep under the waves to unearth pipeline price pressures. With “supply chain” trending and inflation trades all the rage, a more delicate dissection of the PPI should be on the to-do list of true bond vigilantes…or those with a fundamental hankering for going into the weeds, like QI’s Dr. Gates.

Gates’s old-school perspective requires PPI metrics be referenced by their stage of processing — ‘crude,’ ‘intermediate’ and ‘finished.’ When pipeline pressures would build in past cycles, the Street would monitor sets of waves in crude, intermediate and finished goods PPI inflation to gauge whether pass-through from the supply chain would generate upward movement in consumer prices. Then globalization happened (read: China entering the World Trade Organization in 2001). Being a pipeline watcher was relegated to the Mesozoic Era. The trade war and, more forcibly, the pandemic’s effect on the supply chain reasserted the idea of waves into the price setting mechanism.

Watching pipeline costs entails more than assessing inflation risks; they also matter for the growth outlook. Take the pipeline cost spread (purple line), defined as the spread between intermediate and finished goods PPI inflation. Over the last 50 years, many waves are visible through business cycle expansions. The current episode, however, echoes 1970s-style inflation risks. Yesterday’s PPI report revealed that intermediate PPI inflation has exceeded that of finished goods by a double-digit margin for six consecutive months ended October. In the last half century, with respect to duration, only the seven-month stretch from July 1974 to January 1975 compares.

History doesn’t repeat itself, but it sometimes rhymes. Not surprisingly, 1974’s persistent cost pressures coincided with a decline in the ‘it-girl’ – the ISM Manufacturing New Orders index. The upstream cost bulge in 2021 has seen this metric fall out of the right tail distribution, ending a 15-month winning streak north of the lofty 60 mark (green line). Is there more to come?

Because of its stalwart postwar track record, U.S. ISM Manufacturing New Orders provides a signal for firms of all sizes, including those on Main Street. The 1974 experience saw a sharp decline in small business economic expectations. In 2021, the path has similarly led to near record pessimism (orange line). QI friend and mentor National Federation of Independent Business (NFIB) Chief Economist Bill Dunkelberg put it this way: “Not knowing the course of federal economic policies (e.g., taxes) makes it harder to make the investment expenditures that will be needed to raise worker productivity. Add to that the unclear course of the virus and associated government policies and owners face an economy filled with uncertainty that must be resolved to figure out the likely course of the economy.”

Moreover, small business owners capitulated on their future view of the economy view by flagging a further deterioration in earnings (red line) and a stalling in expectations for real sales volume over the next six months (light blue line). With profits challenged and revenues expected to stall, what’s a proprietor to do in this higher material, transport and labor cost environment? In October, a record 51% said they planned to raise prices to combat this testy triumvirate (yellow line).

The latest CFO Survey validated: “Most CFOs also indicate in the third-quarter survey that their firms are experiencing supply chain disruptions that are expected to last well into 2022 [and]…Small firms note less ‘room to maneuver’ and are more likely to report waiting for supply chain issues to resolve themselves.”

Federal Reserve Vice Chair Richard Clarida would concur. In (very) prepared remarks, the Fed official who wrote the book on inflation expectations dictating monetary policy, dryly noted that he, “would not consider a repeat performance next year a policy success.” Though he towed the party line, noting that the 4.4% increase in the PCE — which the Fed traditionally hid behind to keep Quantitative Easing humming, was a “moderate overshoot” (or more than double) the Fed’s 2% target, it must have been painful to be conciliatory when inflation expectations have gone haywire.

Perhaps Clarida is trying to ride the wave until January 31st, when his term ends, and vacate the Eccles Building before the inevitable wipeout hits. With pipeline cost pressures persisting, the risk of inflation psychology becomes ingrained into Main Street business decision-making. Adjusting to such an environment may not be smooth surfing.

We Go Together

VIPs

  • The S&P 500 Basic EPS Hotels was never negative until 2020, and has stayed in contraction for the last seven quarters; despite their historically tight correlation, hotel occupancy has recovered to pre-pandemic levels while hotel profits lag on account of higher input costs
  • Since bottoming out in April 2020, hotel workers have seen their aggregate hours worked recover 111%; meanwhile, linen/uniform supply workers have only risen 38%, diverging from the former as services previously contracted out are brought in-house to cut costs
  • Per Cirium, airlines are increasing flights between the UK and U.S. by 21% MoM as U.S. borders are re-opened to vaccinated travelers; inflows from nonresident travelers should drive service consumption, though this will manifest in GDP accounting as export services


We go together
Like rama lama lama ka dinga da dinga dong
Remembered forever
As shoo-bop sha wadda wadda yippity boom de boom
Chang chang changitty chang sha-bop
That’s the way it should be
Wah-oooh, yeah!

The tongue-twisting opening lines to the final song of the 1978 musical romantic comedy Grease can’t help but bring a smile to your face. Many (ill-sighted) critics saw the film as mediocre, condescendingly describing it as “a pleasing, energetic musical with infectiously catchy songs and an ode to young love that never gets old.” The timeless classic featuring greaser Danny Zuko and Australian transfer student Sandy Olsson found its place in the archives in 2020 when the film was selected for preservation in the National Film Registry by the Library of Congress as being culturally, historically and aesthetically significant. What took them so long?

Going together in economics has a different connotation than “Summer Lovin,’” “Hopelessly Devoted to You,” and “You’re the One That I Want.” Eyeballing what Danielle calls a “huggy-bear” relationship between two distinct gauges gains credence when the correlation (better known as the ‘r’) rises to noteworthy heights, which you see on the left. Over time, the seasonal movement in U.S. hotel occupancy (orange line) has been a key driver of operating earnings per share (EPS) in the S&P 500’s hotel sector (purple line). We know we’re not breaking new ground in deducing that demand for hotel stays, whether for business or leisure, drives revenue per available room — the industry metric for top-line activity.

However, in the post-COVID-19 world, a disconnect has emerged. Hotel EPS has had a record run in negative territory, while hotel occupancy has fully recovered to pre-pandemic levels. Never before 2020 had the S&P 500 hotel sector recorded contracting EPS. Seven quarters later, it appears permanent damage has been inflicted.

As for the light at the end of the tunnel, with profits lagging occupancy, major lodging operators have gotten creative to save on the cost side of the ledger. Even at what we once considered “posh digs,” services are limited. The norm these days is your room is serviced every third day, meaning never for most staying 2-3 nights. That duration is standard fare for the leisure traveler who’s largely replaced the once lucrative business traveler. The front desk is most cordial about explaining the effective inflation — you are paying more for less — as “You understand, with the COVID restrictions and all…” Savvy travelers have learned a few tricks — ask for towels to be replenished, fresh toiletries delivered and then they make their own damn beds if they need to return to a room that’s tidied up.

This has played out in a diverging recovery between hotel workers and those whose services are contracted out, such as those in the linen and uniform supply industries that also includes industrial laundries. In an industry like accommodation, workers’ input is essentially the equivalent of the businesses’ output. Aggregate hours worked, a measure of the number of payroll jobs times the average workweek, is the conventional way to judge guidance.

As you see on the right, both hours worked series for hotel workers and linen/uniform supply workers were indexed to the COVID low point of April 2020. Normalizing as such determines if both groups would recover in concert. It’s clear that they have not. By June 2020, hours worked for hotel workers began to outperform that of the linen/uniform supply group – and they never looked back. To date, through September 2021, the former rose 111% off the bottom, while the latter only advanced 38%.

For the most part, the recovery in hotel activity has been limited to domestic travelers. That’s about to change. As announced Sunday, after 20 months of travel restrictions, U.S. land and air borders are reopening to foreign visitors. The new rules allow air travel from previously restricted countries if the entrant has proof of vaccination and a negative COVID-19 test. Land travel from Mexico and Canada will require proof of vaccination, but no test. Airlines are expecting more travelers from Europe and elsewhere. Data from travel and analytics firm Cirium show airlines are increasing flights between the United Kingdom and the U.S. by 21% this month over October.

How this encouraging news could play out in gross domestic product (GDP) math is another story. U.S. net foreign travel services — the difference between what U.S. residents spend in foreign countries and what foreigners spend in the U.S. — is about to roll off its peak September print. The pent-up demand of inflows of nonresident tourists should be the more influential factor driving service consumption. For what it’s worth, in the three months ended September, net foreign travel had accounted for nearly one-third of all real consumer spending on services. The wind is about to shift on consumer spending. That said, it will manifest as export services in the trade gap, so all is not lost. Any growth from the influx of foreign travels should be a net-plus for the trade gap.

The way GDP accounting works suggests reopening borders will be a wash as activity moves from consumption to exports. The math for the hotel industry is much more straightforward – any incremental travel demand will support a return to profitability. In the interim, expect cost-saving initiatives to become a more permanent staple for hotel operators, all in the name of productivity and profits first.