Surrendering to the Orange Vest

VIPs

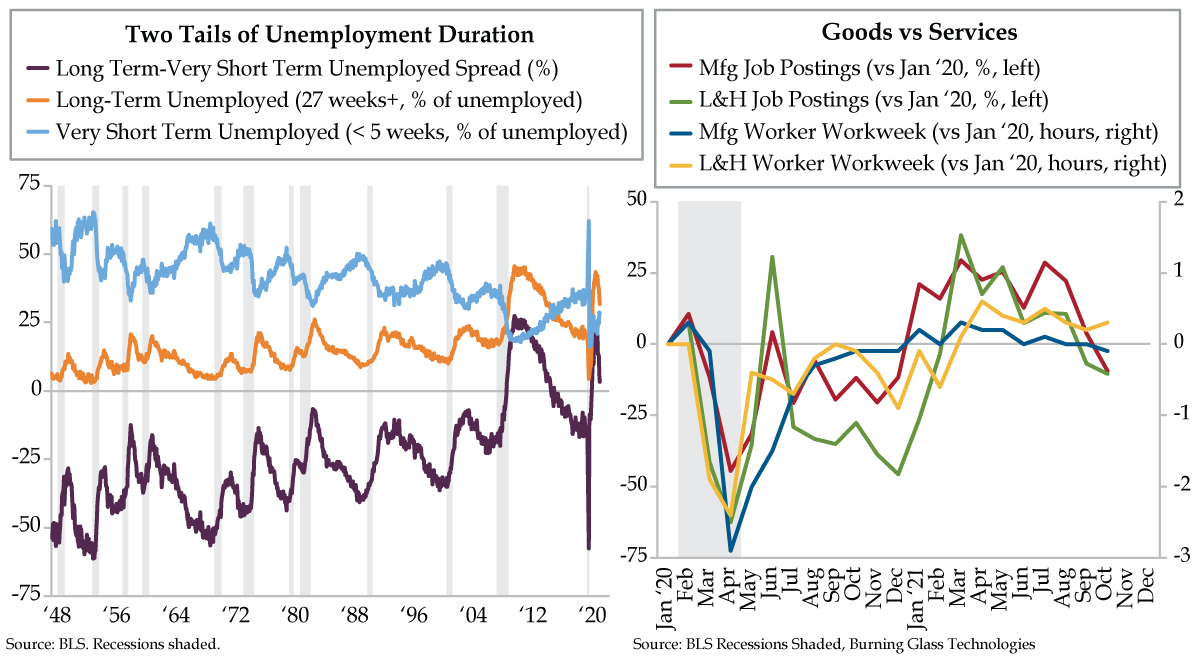
  • At 28.3%, those who have been unemployed for fewer than five weeks are now at a post-pandemic high; meanwhile, 31.6% of the unemployed have been out of work for more than 27 weeks, a 13-month low but still well above the 19.3% registered in February 2020
  • After hitting a high of 41.7, the manufacturing worker workweek has fallen to 41.3, the lowest since December 2020; in leisure and hospitality, the workweek peaked at 25.3 hours in April with the last round of stimulus checks, before falling slipping back to 25.0
  • Per Burning Glass, job openings in manufacturing are at -9.5% in the week ended October 29 vs. January 2020, the first negative read since last November; at -10.5%, leisure & hospitality openings have contracted for the last two weeks to their worst showing since January

“Mommy’s alright, Daddy’s alright
They just seem a little weird
Surrender, surrender
But don’t give yourself away”

Gotta love a true contrarian. Pushing back against the conventional wisdom and profiting is as good as it gets. Who knew this applied to musicians? In 1976, Cheap Trick first played “Surrender” on tour. The ‘70s anthem was subsequently recorded in studio and released in 1978. Isn’t the band supposed to first record and release the potential hit and then have its popularity carry over into lucrative concert tours? As if there isn’t enough irony in what you’ve just read, the first song featured on their third studio album, “Heaven Tonight,” tells a contrarian story of a teen’s realization that his parents weren’t uncool after all, despite the generational divide. Though the “teen” singing the song says his parents were “a little weird,” he then stumbled into their “rolling on the couch” listening to KISS records. To get into the right frame of mind to pen the lyrics, songwriter and lead guitarist Rick Nielson said he had to, “go back and put myself in the head of a 14-year-old.”

Economists and investors alike had to surrender to the reality of what appears to be full employment with wage inflation nowhere near retreat and signs that it’s pinching margins in the current quarter through which we’re nearly halfway through. On Friday, Factset’s John Butters noted that, “For Q4 2021, 41 S&P 500 companies have issued negative EPS guidance and 26 S&P 500 companies have issued positive EPS guidance.” While in line with the 5-year average, it’s still the mirror image of where we were three months ago when 29 firms were guiding negatively and 42 were telling investors to expect upside.

The bravado gainfully employed workers are brandishing was evident in those who’ve been unemployed for five weeks or less (light blue line). At 28.3%, these effective job hoppers as a percentage of the unemployed are at a post-pandemic high. If you’ll indulge some anecdata, here in Dallas, a colleague who runs the third-party logistics arm for a Fortune 100 had a new hire quit after two days in protest of being made to wear the same orange safety vest required of all warehouse workers.

At the opposite end of the spectrum are the long-term (LT) unemployed. You know that we’ve been increasingly concerned about the element of scarring that’s becoming increasingly apparent, as in structural damage to the labor force. While the 31.6% of the pool of unemployed who’ve been out of the workforce for 27 weeks or more (orange line) is at a 13-month low, it’s still the highest since January 2015. The journey from that month’s 31.3% ended in February 2020, when it hit 19.3% before COVID-19 started wreaking havoc on the data. That datapoint marked “full employment” as defined by Federal Reserve officials.

Given the abrupt nature of the economic slowdown and the dim prospects for fresh rounds of nationwide stimulus checks, the risk is we may be approaching the current cycle’s lows in the percentage of LT unemployed.

What’s exceedingly rare is the percentage of LT unemployed being higher than that of the very short-term (VST) unemployed (purple line), a manifestation only seen in the past two cycles. The word “structural” once again rises to the fore.

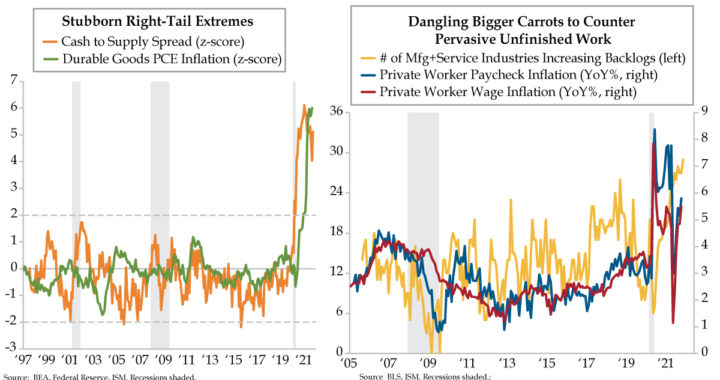
The most cyclical parts of unemployment occupy the tails – LT and VST. These series gauge the bad vs. the good in the unemployment distribution. In the postwar period, VST trended above LT, which is intuitive in “the land of opportunity.” VST are seizing opportunities because they can easily secure a bigger paycheck. The last two cycles’ persistently high LT unemployment speaks to the permanent dislocation that’s made it more difficult for workers to become re-employed.

And here’s the linchpin via QI’s Dr. Gates: “This spread line shows that this IS NOT a theme unearthed because of COVID. It also happened after the Great Financial Crisis (GFC). Throw in that productivity was downshifting before the GFC and seemed structurally lower over that entire episode. As a result, certain sectors may not have been able to carry the same labor share and jettisoned workers leaving a permanent scar on LT unemployed.”

One final note – this phenomenon is a novelty of the post-Quantitative Easing era. Can we be surprised that incentivizing the monopolization of the economy via the conduit of passive investing institutionalized by the Fed Put has permanently shrunken the labor force participation rate?

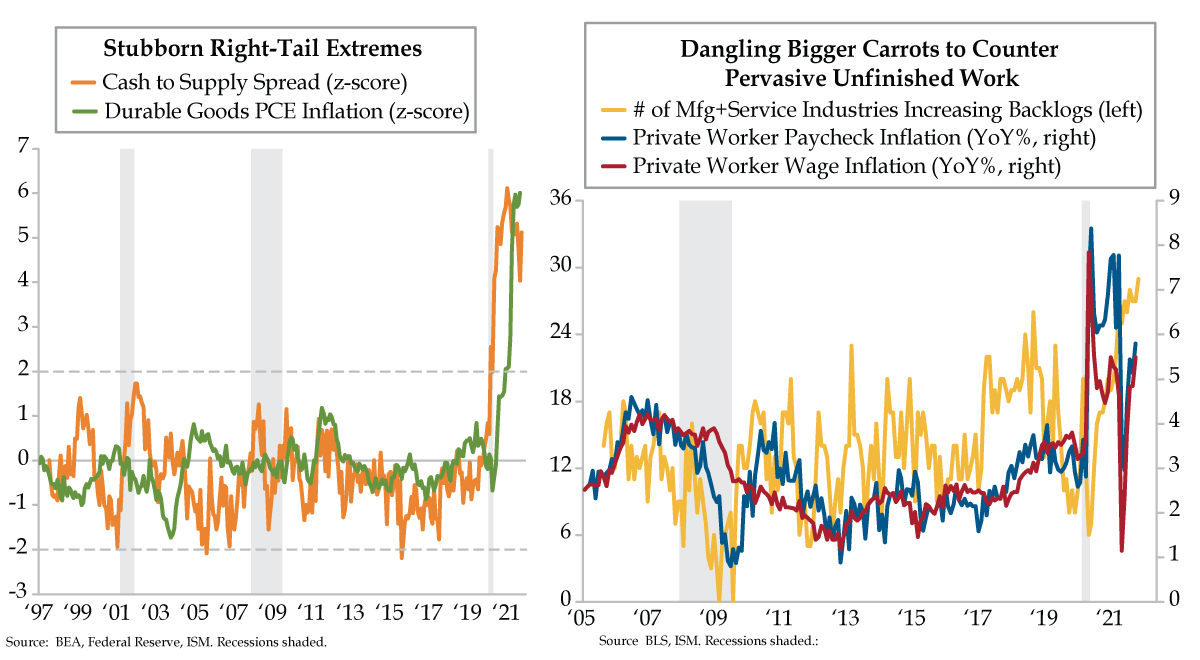
Today’s right chart certainly seems to concur with that conclusion. After reaching a high of 41.7, the manufacturing worker workweek (blue line) has slumped to 41.3, the lowest since last December. As for the media-hyped over-stretched Leisure & Hospitality (L&H) sector (yellow line), the workweek peaked at 25.3 in April 2021, the month those stimulus checks hit (which is surely a coincidence) and has since drifted to 25.0.

Employers not having to stretch their workers so thin should show up in reduced demand for fresh hires. Per Burning Glass Technologies real-time weekly data, at -9.5% in the week ended October 29 and vis-à-vis a January 2020 baseline, job openings for manufacturing positions (red line) are negative for the first time since last November. As for L&H openings at -10.5% (green line), they’ve been contracting for the last two weeks and are at their worst showing since this past January. To what are employers surrendering if not reduced demand?

Exploding Bamboo

VIPs

  • Unit Labor Costs saw a spike to 8.3% in the third quarter, beating out the 7.4% consensus and soaring above Q2’s 1.1% rate; while labor costs grew at their fastest pace since 2014’s first quarter, productivity moved in the other direction with a 5% drop, its worst since 1981
  • The white LFPR has recovered to 65.7% from February 2020’s 68% vs. the black LFPR falling from 63.1% to 61.3% and the Hispanic LFPR from 63.2% to 61.5%; 2.8 million Black and Hispanic workers still remain out of work due to COVID and rising childcare costs
  • The White unemployment rate is 1.1% above its February 2020 levels vs. 2.0% and 1.9% higher for Blacks and Hispanics, respectively; with minority groups seeing higher permanent job losses as well, recovery is far from the inclusiveness Powell aspires to achieve


You’d have thought that along with baseball and apple pie, fireworks would have been invented in the United States. But, baseball is the one and only real deal, having been started in 1845 when the rules were written by the New York Knickerbocker Club. As for the case of that iconic dessert, the first apple pie recipe was published in England in the 14th century. Fireworks date back even further and conjure images of naughty teenage boys tossing things into fires to see how they will react, which is sometimes with a bang. In the second century B.C. in ancient Liuyang, China, it was bamboo stalks that were being thrown into fires. The explosion that followed resulted from overheating the hollow air pockets unique to bamboo, which is a grass, not a tree. The Chinese believed that nature’s “firecrackers” warded off evil spirits. Roughly 2,700 years later, a Chinese alchemist mixed potassium, nitrate, sulfur and charcoal which became a black, flaky powder and was the world’s first gunpowder. Combine the old with the new by pouring this innovative powder into bamboo and voilà — the first man made fireworks.

Over the past week, fireworks have been going off aplenty on Wall Street. It started last Friday with the release of the third quarter Employment Cost Index. The economics community saw a rise coming – they’d penciled in an acceleration to 0.9% from the prior quarter’s 0.7% pace. Instead, the 1.3% print marked the fastest pace in the series’ 39-year history. The hits kept coming yesterday, with the spike in third quarter Unit Labor Costs to 8.3%. Once again, economists anticipated a massive pop of 7.4% from the second quarter’s 1.1% rate. If you net out the violent moves induced by the pandemic, labor costs grew at the fastest pace since 2014’s first quarter. The mirror image – productivity – collapsed at a 5% rate, its worst showing since 1981. We know there are massive disruptions that continue to plague the bean counters’ best efforts; there is no doubt an element of distortion that suggests you fade the magnitude of these moves. But we are talking quarterly series in all three cases, which cannot and will not be ignored inside the microcosm of PhDs at the Federal Reserve.

Whatever will Jay Powell do if wage inflation persists for several more quarters? We hate to use the term “conundrum,” but that’s what he’s facing. In Wednesday’s painful post-FOMC presser, in defiance of Merriam-Webster, he bumbled about trying to convince himself that “transitory” was measured subjectively. Powell is desperate to buy time with such nonsense. And we would argue that he a leg to stand on as it pertains to the most pernicious form of rising costs – wage inflation.

Achieving “maximum inclusive employment” by June 30th would be a miracle and Powell knows it. That’s why he’s deluding himself that he won’t have to quicken the pace of the taper much less hike rates come July. Viewers of the press conference may have noted the most confrontational interaction with reporters we’ve seen since Pedro da Costa asked Janet Yellen about the Medley scandal. The highest inflation many have experienced in their lifetimes is undeniably a regressive tax, harming lower-income earners appreciably more than their high-income-earner counterparts.

That’s what brings us to the above referenced leg Powell has to stand on and defines the dilemma he faces as tightening into a slowing economy never ends well. This point may not resonate with those on the receiving end of soaring wages. But it sure does with the lowest income earners who’ve slashed their budgets to accommodate the higher costs of essentials, from housing to groceries to gasoline. And that’s the case for those with incomes. As you see in today’s left graph inset, the labor force participation rate (LFPR) among Whites (yellow bars) has recovered to 65.7% from February’s 68.0%. We’ve seen appreciably less of a bounce back in the LFPR of Blacks (red bars), which has moved down from 63.1% to 61.3%; Hispanics (blue bars) have fared about the same, with their rate at 61.5% vs. that which preceded the pandemic of 63.2%.

The blue-shaded area of today’s right chart fills in another blank. If you tally the number of Black and Hispanics who are unable to or not looking for work due to COVID-19, you see an enormous improvement from May 2020’s peak of 22.7 million. But the 2.8 million who remain is still a materially high figure. Think about how skyrocketing childcare costs factor in disproportionately for those who earn the least. Moreover, these same workers are also the least likely to have jobs that can be performed remotely.

We present the data on LFPR and those who’ve been yanked out of the workforce to contextualize the unemployment rates, which can’t properly reflect these elements. Even so, the unemployment rate recoveries are still nowhere near the “inclusivity” Powell aims to achieve. Since February 2020, the unemployment rate for Whites is 1.1% higher (blue line) while those of Blacks (red line) and Hispanics (blue line) remain 2.0% and 1.9% higher, respectively. As for permanent job losses, in the case of White workers (green line) they number 160,000 more than they did in February 2020 vis-à-vis Blacks (orange line) at 174,500 and Hispanics (purple line) at 214,500. Even against the backdrop of clear labor market scarring, the fireworks promise to continue in coming months.

Shake a Tail Feather

VIPs

  • The Cash to Supply spread, comparing cash equivalents to ISM inventories, has been above a +2 z-score for 18 months and was +5 in October; the series leads durable goods inflation, which snapped its 25-year deflationary trend last year and registered a +6 z-score this month
  • Per ISM, backlogs are increasing in 29 out of 36 industries across manufacturing and services, a record high; as a result of the bottlenecks, the U.S. labor market is seeing earnings growth in the right-tail, with both paycheck and wage inflation above the 5% YoY threshold
  • Yield curves steepened after yesterday’s tapering announcement by the Fed, though Powell held firm on decoupling tapering from rate hikes; however, the potential for further flattening long-term remains strong as evidence continues to defy the transitory narrative


“Excuse me, I don’t think there’s anything wrong with the action on this piano.” And at that point, the proprietor of Ray’s Music Exchange sat down at the keys and broke into an upbeat rendition of “Shake a Tail Feather” prompting the whole neighborhood to show off their best dance moves. It was all done to convince The Blues Brothers that the electric piano — for which Ray (as in Charles), was willing to throw in the black keys for free — was the best in Chicago. There never was an actual store called Ray’s Music Exchange. The mural everyone danced in front of on the Prairie Avenue side of the building at 300 East 47th Street in Chicago was painted during the production of the cult musical comedy in 1979. Among the artists depicted were Charles himself, Muddy Waters, Mahalia Jackson, B.B. King, Dizzy Gillespie, Curtis Mayfield and Stevie Wonder. Sadly, the wall painting that celebrated these great musicians and drew fans of the movie from around the world for 40 years was sacrificed when the building was demolished following a fire in 2020.

Speaking of shaking tail feathers or just tail of a distribution… Regular readers appreciate our affinity for the great normalizer, the z-score. If you’ll indulge a bit of nerdiness, this metric contextualizes statistics in a standard normal distribution. There is a special normal distribution with a mean of zero and standard deviation of 1. The standard normal distribution is centered at zero and the degree to which a given measurement deviates from the mean is given by the standard deviation. For the standard normal distribution, 68% of the observations lie within 1 standard deviation of the mean, 95% lie within two standard deviation of the mean, and 99.9% lie within 3 standard deviations of the mean.

With that lesson on probability behind us, focus your lens on today’s left chart, which updates a chart we published in May. The Cash to Supply spread (orange line) is an inflation leader that combines cash equivalents (money of zero maturity, MZM) against inventory sentiment measures from both Institute for Supply Management (ISM) manufacturing and service reports. This gauge was created in the spirit of Milton Friedman’s “too much money chasing too few goods” mantra that all students of the dry science learn via osmosis with other economists.

The ebb and flow in the Cash to Supply spread has tended to track and lead that of pricing for durable goods over time. This is the part of the inflation mosaic that’s been significantly altered in the post-COVID era. For 25 years prior to the pandemic, durable goods prices were in deflation. That ended in 2020 and the segment’s inflation has stretched into 2021. The durables deflation/inflation rate has been z-scored (see above and simply put, deviation from the mean adjusted for volatility applied) to level the comparison with the Cash to Supply spread, which itself, is a difference of two z-scores.

Recall the standard normal distribution definition and examine all the data points that fall between the dashed horizontal lines of -2 and +2 z-scores. Most of them fall within that range. Only the far right of the chart has risen well north of +2 and has yet to show decided momentum to fall back within the usual historical range. In fact, the Cash to Supply spread has been obstinately above a +2 z-score for 18 straight months and most recently snapped back above a +5 reading in October, persistently flagging too much money chasing too few goods. Durable goods inflation has persistently exceeded +2 on the z-scale for 10 months in a row and in October registered a +6. This is not an episode of The Twilight Zone. These stubborn extremes continue to shake a tail feather at Team Transitory.

A large cash pile and an undersupplied supply chain aren’t the only right-tail observations that prevail today. As you see in today’s right chart, backlogs across the U.S. economy have become so pervasive as to be occurring in 29 out of the 36 industries designated by the manufacturing and service sectors combined (yellow line). This. Has. Never. Happened. Before.

Note that widespread backlogs signal unfinished work. To pare down the pile of domiciled inboxes from input shortages, transport delays and lack of warm bodies to fill positions, larger carrots have been dangled across the workforce in the form of higher wages. Longer hours go hand in hand with an environment of rising unfilled orders. Ergo, paychecks follow by fattening like Thanksgiving turkeys readying for slaughter. COVID base effects have washed out of year-over-year comparisons for wages (red line) and paychecks (light blue line). Readings above the 5% threshold for both gauges tell us we’re in a right-tail environment in the U.S. labor market.

It doesn’t take a legendary, blind soul music genius like Ray Charles to see that a leader of inflation in durable goods has persevered outside the distribution for the first time since the late 1990s and is refusing to normalize. Wage pressures also are bubbling as backlogs have never bulged to this extent. Yield curves steepened after yesterday’s Fed taper announcement as Fed Chair Powell held firm on divorcing the process of tapering from rate hikes. That said, those betting on a flattening bias should not be deterred. Team Transitory keeps losing its fan base.

Duck Test

VIPs

  • Lower, middle, and upper-income cohorts all had net pessimism regarding auto buying conditions, at -24%, -30%, and -35%, respectively, in October, per UMich; upper-income buyers have been the most pessimistic group in the last three months, not seen since 1981
  • Since 1967, the correlation between CPI new vehicle inflation and new vehicle sales has been -0.47, with sales tending to rise when price rises moderated or fell; at roughly 9% YoY, current new vehicle inflation calls back to the 1970s, when sales ran at a 5-10 million SAAR
  • Though October sales bounced back slightly to a 12.99 million SAAR, the downtrend since April’s 18.3 million still has room to run; the stellar bounce back to 16.3 million SAAR in 2022 is predicated on supply chains normalizing & demand not having been pulled forward


“If it looks like a duck, swims like a duck and quacks like a duck, then it’s probably a duck.” Attribution for the phrase goes to the “Hoosier Poet” James Whitcomb Riley of Greenfield, Indiana. In 1849, he wrote: “When I see a bird that walks like a duck and swims like a duck and quacks like a duck, I call that bird a duck.” Over the years, this declaration has morphed into the so-called “duck test,” a form of abductive reasoning to determine the nature of an uncertain thing or situation, usually in the absence of, or in spite of, concrete evidence. The duck test’s logical inference starts with an observation or set of observations and then seeks the simplest and most likely conclusion from the explanation.

Does the duck test apply to price shocks? Over the course of U.S. business cycle history, the most convincing price-shock duck test coincided with spikes in crude oil prices. The Arab oil embargoes that generated the energy crises (plural) of the 1970s have a place in the history books – and get a passing grade, for sure. The Iraq invasion of Kuwait which ushered in the Gulf War and the 1990-91 recession saw oil prices double from $20 per barrel to $40 and also meant there was a high probability that we had a small aquatic bird of the family Anatidae on our hands. In all cases, prices at the pump surged, and the most visible price in the U.S. economy, that of retail gasoline, created the pain point for purchasing power.

What about an auto price shock? Sure, consumers are now able to view prices more readily than in past economic cycles with the advent of the information age and price transparency by auto manufacturers and auto dealers. Who hasn’t used cars.com or Kelley Blue Book or Edmunds?

But an auto price shock wouldn’t and couldn’t generate the buy-now mentality and urgency of an oil shock. Gasoline is a high frequency purchase measured in weeks. Auto-buying frequency is measured in years. Buyers observe prices and price movements more frequently with the former than the latter. That said, this statement is disproved in today’s left chart.

The entire income distribution has coalesced around the vehicle price narrative. Prices have become such an impediment to buying conditions that lower-, middle- and upper-income households all indicate that it’s a bad time to buy. For the past six months, there have been fewer respondents stating it was a good time to buy because of low prices relative to those who said it was a bad time to buy due to high prices. As recently as March, all three groups registered optimism with regard to prices: lower at 4%, middle at 9% and upper at 13%. In October, pessimism reigned: lower at -24%, middle at -30% and upper at -35%.

The most unique thing about the past three months was that upper income buying conditions related to prices were worse than both the middle and the lower tiers. This inversion from the top down in August, September and October was only equaled one other time in history: November 1981. For perspective, the biggest earners are the biggest spenders when it comes to new vehicle consumption. About 60% of cars and trucks are bought by the top-third, roughly 30% by the middle-third and around 10% by the bottom third, according to the Bureau of Labor Statistics’ 2020 Consumer Expenditure Survey.

Since the late 1960s, new vehicle inflation has been inversely related to new vehicle sales. The correlation between the right chart’s two series has been -.47 since 1967. This mirror image chart shows automakers consistently sold more product when price increases were moderate (between 0% and 5%) or declining. Current consumer price inflation for new vehicles around a 9% year-over-year rate harkens back to the 1970s, when sales trended between a 10 million to 15 million seasonally adjusted annual rate (SAAR). At the extreme, inflation above 9% led to a sub-10 million SAAR.

A cross check with the first chart’s outlier – November 1981 – lead us to ask: “What if auto price shock turns to slump?” What followed the inversion in the income distribution back then was a capitulation at a lower SAAR. In the 12 months that followed November 1981, sales averaged 10.2 million. Even though we saw a slight bounce in October sales to an unrounded 12.99-million SAAR rate, if history repeats itself, the downturn that started from April’s 18.3 million SAAR still has room to run.

To be sure, persistently high auto inflation would have to hold to generate a persistent sales slump. Whether we have all the details correctly placed in the current risk scenario is a moot point. What we do know is that the consensus anticipates a bounce back in the SAAR from 15.5 million in 2021 to 16.3 million in 2022 to 17.0 in 2023 before leveling off in the high 16s out to 2027. Underlying that medium-to-longer run outlook are two assumptions – shockingly high auto prices will fall back as the supply chain normalizes in the next two years and that unprecedented levels of stimulus-spending have not pulled forward an unparalleled level of demand.

A duck test for a slump in auto demand due to high prices only can be harvested over the next year. At least we know the consensus is pricing for the opposite to occur.

History’s Hometown

VIPs

  • The ISM New Orders-Inventories spread shrunk to 2.8 in October, the lowest since last year’s re-opening; as a z-score, this is below trend at -0.67, and mimics the rest of the world, with only 59% of major economies seeing spread expansions, the worst since June 2020
  • The factory workweek plus overtime collapsed from 45.7 hours in February 2020 to a low of 41.3 hours in April amidst pandemic shutdowns; since recovering in January, performance has been up-and-down, before settling just below January’s print at 45.6 hours in September
  • ISM’s lead time commitment for production material advanced to 96 days in October from September’s 92 days; higher upstream costs have manifested into a near-record level of credit extension, with the NACM’s Credit Managers’ Index registering a 70.0 print in October


About 30 miles southwest of Syracuse in the Finger Lakes region of upstate New York sits a small city rich in American history. Auburn, New York has been dubbed “History’s Hometown” as it’s a hub of key figures, events and culture with attractions pertaining to the Civil War era, the Underground Railroad and the birthplace of talking films. Even the 1888 invention of the time clock is linked to an Auburn jeweler — Willard Le Grand Bundy. He patented his design two year later and he and his brother, Harlow, thus formed the Bundy Manufacturing Company to mass-produce time clocks. In 1900, the time recording business of Bundy Manufacturing, along with two other related businesses, consolidated into the International Time Recording Company (ITR). In 1911, ITR, Bundy Manufacturing, and two other companies were amalgamated (via stock acquisition), forming a fifth company — Computing-Tabulating-Recording Company (CTR). Ultimately, it would change its name to International Business Machines, better known today as IBM.

Time clocks, or punch clocks, usually were reserved for hourly workers to record their toiling in manufacturing and service occupations. Employees punched in to start their workday and punched out to end it, sometimes with the asterisk of overtime hours being documented. This Friday’s U.S. employment report for October will provide the latest update for the private nonfarm economy.

Each month, only the most cyclical industries in manufacturing provide a prism into both average weekly hours and average overtime hours. No other private sector industries report this level of detail to the Bureau of Labor Statistics. The COVID-19 shock saw the factory worker workweek plus overtime collapse from 45.7 hours in February 2020 to a cycle low 41.3 hours in April 2020. Nine successive monthly gains later and full recovery was achieved in January 2021. Since then, however, the performance has been anything but streaky. Ups and downs have punctuated 2021; by September, this metric stood marginally below where it started the year, at 45.6 hours.

For cyclical indicators, a bumpy ride typically foreshadows a turn in the trend. Judging from the relative distance between demand and supply for forward guidance, there is a greater risk that hours get lowered than raised. This read can be gleaned monthly via the new orders to inventories spread in manufacturing from the Institute for Supply Management (ISM). At face value, the spread compressed to 2.8 in October, the lowest since the involuntary bounce back occurred after the height of the pandemic, in Spring 2020. Over the last several years, a reading like this, however, would be considered below trend, at -0.67 (red line) – the context for which is attained by applying our favorite normalizing z-score process (deviation from the mean adjusted for volatility).

The new orders-inventories spread gauges near-term output prospects, which carries over into predicting working hours. A wider spread suggests stronger activity and longer hours to get the job done. When the combination of orders-inventories compresses, as is the case today, this bearishly indicates fewer labor resources are required. The easiest “fix” is adjusting hours. The normalized year-over-year trend in the production workers’ workweek plus overtime (blue line) looks set to slide below trend just like its ISM guide.

The global environment provides a backdrop for the narrative of punching shorter time clock hours which can be observed across the mosaic of global manufacturing purchasing manager indices (PMIs). Of the 41 countries we track, the breadth of expansion in new orders-inventories has declined to 59% so far in October, the least positive performance since June 2020 (green bars).

ISM expounded at length “that their companies and suppliers continue to deal with an unprecedented number of hurdles to meet increasing demand. All segments of the manufacturing economy are impacted by record-long raw materials lead times, continued shortages of critical materials, rising commodities prices and difficulties in transporting products. Global pandemic-related issues – worker absenteeism, short-term shutdowns due to parts shortages, difficulties in filling open positions and overseas supply chain problems – continue to limit manufacturing growth potential.”

Persistently elongated lead times increasingly slow the production process. Look no further than ISM’s lead time series for production material commitments. Last month, we noted that the time it took to acquire these key inputs rose to an average of 92 days in September, comparing only to the longest postwar lead times encapsulating the 1973-74 period. October offered no relief — this metric advanced to 96 days (orange line). Reading truckers’ anecdotes suggest the prolongation will persevere as the supply chain’s disruptions don’t get resolved until well into 2022, regardless of whether demand plummets in the interim.

Lead times echoing the 1970s inflation era translate into the need to attain higher leverage as the most cyclically exposed industries’ budgets get busted. The risk is that it flows down the distribution chain to service industries with the highest supply-chain exposure. The purple line depicts how the higher upstream cost backdrop has manifested itself into a near record level of credit extension (70.0 on a 50 breakeven) across both the manufacturing and service sectors, according to the October National Association of Credit Management Credit Managers’ Index.

Time clocks look set to get punched with shorter workdays as worsening vendor performance moves in gray clouds over the short-run industrial outlook. Expect the collective of the Street forecasting community to roll out the catchphrase “mid-cycle slowdown” to describe this episode. A better characterization would be the new darling term of “bottleneck recession.”

The Ties that Bond


VIPs

  • China’s manufacturing PMI was 49.2 in October, just below September’s 49.6 print as energy remains constricted; crude stockpiles hit 919 million barrels by October 24, 59% of capacity and the lowest since November 2018, and 13% of coal capacity remains offline
  • At 31.7, ISM Mfg Customers’ Inventories are at their highest levels since February, despite lingering supply chain woes; as is the case with China, the globe’s marginal driver of demand, New Orders in the U.S., appear set to decline as inventories are replenished
  • China’s services and construction PMI had a headline of 52.4 in October, shy of the 53.0 consensus forecast and well below September’s 53.2; economic activity in the world’s second largest economy is at the cusp of contracting, bringing with it a sizable deflationary impulse


Shame on Daniel Craig for catalyzing an existential crisis. Prior to this momentous development, there was great confidence in the halls of QI that the late Sir Sean Connery would never be dethroned as the best James Bond of all time. Alas, No Time to Die has scuttled the rankings. On Sunday, we re-watched the movie on the big screen, which itself is a post-pandemic treat. Spoiler alert: (many) Kleenex were needed the second time around. The quote M reads at the end was as fitting as could be for a Bond who makes the ultimate sacrifice for God, country and, indeed, the world. Written by American author, journalist and social activist Jack London, who was most famous for penning the novel The Call of the Wild, M’s tribute was as suitable as it was heart-wrenching: “The proper function of man is to live, not exist. I shall not waste my days in trying to prolong them. I shall use my time.”

It would seem Chinese officials are wasting no time broadcasting the country’s economic slowdown. October’s manufacturing PMI was 49.2; a tad lower than the 49.6 reported last month. We know what’s going on – energy in every form is being conserved to the extent diesel fuel is being rationed. As of October 24th, China’s crude stockpiles had fallen to 919 million barrels, 59% of capacity and the lowest since November 2018. Meanwhile, 13% of China’s coal capacity is offline, which equates to about 60 mines. These are meaningful figures when China’s energy consumption is more than 70% coal. A colleague sent a photo of Beijing a few days ago and the skies were blindingly blue. It’s a bit premature for this to be the case given the 2022 Olympics don’t begin until February. One final note on this count is that we forget that Russia is squeezing both Europe and China.

Ex-energy, high commodity prices are likely biting harder as a factor of time given China has been parsing out hoards amassed at cheap prices when the rest of the world was in shut-down mode. And officials are also attempting to slowly blow up its property sector and this isn’t the first time they’ve tried to control this exact same experiment. We could see a shockingly low print for fourth quarter GDP…and officials know it, which means it’s likely worse than most can conceive. As our friends at Gavekal Dragonomics told the Financial Times, “what was an anticipated slowdown in China following the post-Covid boom of the first half of 2020 has evolved into a ‘shocking loss of economic momentum.’”

As for what’s to come, in the same spirit we’ll be glued to our Bloombergs to see where ISM New Orders (blue line) hits the tape this morning, China’s manufacturing PMI New Orders (red line) are closely followed due to their role as being a leading indicator. In February 2020, this gauge crashed to 29.2 but bounced right back to 52.0 the next month. Comparing October’s 48.8 reading to this moment in time is thus a bit of a red herring. The closest legit comparison is February 2016, when the world was embroiled in an industrial recession. Today’s left chart is as self-explanatory as they come – as long as China remains the marginal global consumer of you-name-it, what’s unfolding in China today will induce deflation worldwide. While it might not be perfectly synched, New Orders in the U.S. will be following China’s into the red. In the case of IHS Markit, which reflects all sizes of companies across the U.S., New Orders’ descent is more advanced (yellow line).


Call today’s right chart corroborating evidence of its sibling on the left. Customer Inventories are another precursor to New Orders. To depict the trend, we have to invert the series (green line) – inventories up mean less demand to accomplish the post-pandemic nearly impossible task of fully re-stocking. And yet, we see that firms have been grinding away at this task for months now as inventories, at 31.7, are at the highest level since this past February. That’s saying something given the gnarled supply chain at ports only shows signs of worsening. The sole factor that fills in the blank against such a backdrop is declining demand that’s permitting inventories to build despite how difficult it is to source inputs of all stripes and flavors. As is the case with China’s PMI New Orders, ISM’s New Orders will succumb to the gravity of rising Customer Inventories.


For all of the hullaballoo over the weekend surrounding China’s sanctioning the communique that its factory sector is slowing, the bigger news was its non-manufacturing sector in October, which represents services and construction. The headline slowed to 52.4, shy of the consensus forecast of 53.0 and a marked departure from September’s 53.2. Tally the data and you get to 50.8 at the composite level. Economic output of the world’s second largest economy is at the cusp of contracting.


And in the world’s largest economy? With yet another “hoped-for” vote for the bipartisan infrastructure spending program tomorrow, we remain sidelined, in the ‘believing it when we see it’ camp. God help us if the bigger social spending gets miraculously passed alongside it – U.S. household budgets are already being suffocated by inflation headed into the holiday season. We can only imagine the stress of families having to tussle with it being no time to die come Christmas.

Canada Gets an Adjustment

VIPs

  • The Bank of Canada ended its QE program yesterday, causing a 26 bap jump in the two-year yield in the first twenty minutes after the announcement; after ending Q3 near 50 bps, two-year yields broke the 1% barrier as the BoC let the rate volatility genie escape from the bottle
  • In the BoC’s Q3 Business Outlook Survey, 26% of firms cited difficulties meeting demand, a record high, on account of supply chain issues and a shortage of labor; meanwhile, roughly half of Canadian businesses expect inflation to be at least 3% over the next two years
  • IHS Markit predicts Q3 U.S. GDP growth of 1.6% vs. the 2.6% consensus, with inventories driving the entire gain; trade data feeds this development, with goods exports falling by 5% MoM in September and more empty containers leaving West Coast ports than full ones


Chiropractic medicine began in 1895 when Daniel David Palmer of Iowa, a teacher and grocer turned magnetic healer, performed the first chiropractic adjustment. Palmer believed that adjusting the spine was the cure for all diseases for the human race. His first patient was a partially deaf janitor named Harvey Lillard. While Lillard was working with his shirt off in Palmer’s office, Lillard bent over to empty the trash can. Palmer noticed that Lillard had a vertebra out of position. He asked Lillard what happened, and Lillard replied, “I moved the wrong way, and I heard a ‘pop’ in my back, and that’s when I lost my hearing.” Palmer, who was also involved in many other natural healing philosophies, had Lillard lie face down on the floor and proceeded with the adjustment. The next day, Lillard told Palmer, “I can hear that racket on the streets.” Two years later, Palmer opened a chiropractic school.

Spinal adjustments have been going on ever since. Metaphorically speaking, the Canadian government bond market surprised the world with an unexpected visit to the chiropractor yesterday. The doctor’s address is 234 Wellington Street, Ottawa, Ontario. If you can’t place the location, it’s where Tiff Macklem moonlights as a chiropractor from his day job as Governor of the Bank of Canada (BoC).

In a shock move Wednesday morning, the BoC ended its quantitative easing (QE) program and shifted to reinvestment mode to maintain its balance sheet assets. This hawkish act generated a 26-basis point intraday increase in the Canadian two-year yield in the first twenty minutes after the 10:00 a.m. announcement. The last time there was an uptick in two-year yields of this magnitude was October 2009 when the Canadian economy was emerging from the Great Recession. Two-year yields ended the third quarter around 50 basis points (green bars) and broke through 1.00% in yesterday’s trading session. The BoC let the rate volatility genie escape from her bottle.

Tiff, why the adjustment? BoC projects the output gap will close sooner than anticipated. In July, it called for economic slack to be absorbed in the second half of 2022. This forecast was moved forward to anticipate closure in the middle quarters of next year. As an inflation targeting central bank, the statement also was central to the hawkish pivot (bolding ours): “The recent increase in CPI inflation was anticipated in July, but the main forces pushing up prices – higher energy prices and pandemic-related supply bottlenecks – now appear to be stronger and more persistent than expected.”

Three months ago, we published the left chart. Today seems an appropriate time for an update. For the output gap discussion, there’s persistence in firms facing significant difficulty meeting an unexpected increase in demand, so much so it rose to 26% in the third quarter, a fresh high (orange line). The BoC third-quarter Business Outlook Survey (BOS) noted that this was broad based across sectors and regions with the exception of the Prairies. BoC also explained that two important supply issues — supply chain disruptions and labor shortages — were driving the capacity constraints.

For the inflation debate, shift your focus to the purple line. According to the BOS, almost half of Canadian businesses now expect inflation to be above 3% over the next two years, with most anticipating it will be between 3% and 4%. Firms with inflation expectations above 3% frequently cited supply chain disruptions, fiscal and monetary policy stimulus and recent increases in food and energy prices supporting their elevated – and above target – expectations.

Timing of the BoC move came one day before the U.S. reports its first look at third-quarter gross domestic product (GDP). Going into today’s release, the experts at IHS Markit, who earn their keep making accurate, real-time GDP estimates, anticipated growth of 1.6%, a full percentage point disappointment versus the 2.6% consensus.

The headline number is not where the real story lies. The key aspect of today’s GDP will be the composition between demand and supply, something we flagged three weeks back. Per IHS’s math, there’s a decent chance that final sales (GDP less inventories) now CONTRACTS in the summer quarter and that inventories account for more than the entire GDP gain.

Yesterday’s advance international trade data fed this development. As seen in the right chart, the volume of goods exports appears to have declined by nearly 5% month-over-month in September, dragging the full quarter down by an annualized 7% sequential rate. We include two other series from three Pacific Coast ports to illustrate a point. More empty containers are being exported from Los Angeles, Oakland and Seattle-Tacoma (red line; Long Beach not included because it doesn’t break out outbound empties) than those that are fully loaded (blue line). Until it’s less profitable to ship empties to China, this technical factor is likely to act as an impediment to U.S. export growth.

Whether fundamental or technical, there’s a Pavlovian Street response to unfavorable mixes for near-term growth prospects. As the lightning flattening of the yield curve broadcasted, a chiropractic downward adjustment to fourth-quarter U.S. GDP by the entire forecasting community is in the offing. For the short-run Canadian dollar outlook, slowdown risk from the U.S. would be a bearish offset to the BoC’s unexpected pivot which is advertised as a bullish development. Because of these cross currents, we wouldn’t be surprised if sell-side rates strategists started chirping “overdone” for the sell-off in government of Canadian bonds.


Bear Sightings

VIPs

  • October’s Conference Board consumer survey found 36.0% of consumers polled seeing stock declines in the future vs. 33.3% seeing stocks rising; though conviction is low, the -2.7% spread between increase and decrease was the first bearish signal since July 2020’s -1.8%
  • Income expectations, which have a 0.61 correlation with stock price expectations since 1987, have also cooled slightly; meanwhile, household buying plan uncertainty for autos and homes rose above normal levels in October, on account of higher prices tempering purchases
  • 47.6% of consumers signaled they intend to take a vacation within six months, the highest since February 2020’s 54.9%; Smith Travel Research data shows that intentions have been realized, with hotel occupancy growing at double-digit YoY rates for 31 weeks since March


One can’t further separate the rarified air of Augusta National’s azalea-accessorized greens and Pebble Beach’s ocean views from Hillbilly Golf. Located in Gatlinburg, Tennessee near the Great Smoky Mountains National Park, this half century old establishment qualifiers as the world’s most unusual miniature golf course. You ride an incline railway up the side of a mountain and disembark to choose one of two 18-hole challenges to play downhill. “Dueling Banjos” twang in the background as you play the holes. Expect to pass quaint, countrified obstacles such as outhouses and moonshine stills along the way. One of the most unlikely hazards, a 160+ year old hemlock tree that was on the hill prior to the Civil War, had stood proudly over Hillbilly Golf for 45 years. In 2016, however, it sadly was uprooted during wildfires that hit the area. Thanks to the efforts of Hillbilly Golf’s team, its roots were saved to watch over every player brave enough to grace the (miniature) course.

Dr. Gates frequented this bucket list attraction during his family’s summer vacation. The most interesting sign encountered at the base of the hill before you board the tram reads, “Be Bear Aware: Last Bear Sighting” and the date of the occurrence. Gates did a double take when the date read the same day he was playing, present tense at the time.

Hillbilly Golf link lovers are joined by U.S. households seeing bear crossings. It might be hard to fathom given the U.S. stock market can’t do anything but proclaim one record high after another. Yesterday’s Conference Board consumer confidence survey did just that. Consumers are queried on their expectations for stock prices in the next 12 months. In October, 36.0% of consumers polled saw stock declines over the horizon vis-à-vis 33.3% calling for rising stocks. Moreover, only 30.7% thought stocks would be unchanged. For what it’s worth, the distribution of answers – all with 30-handles – exuded low conviction. The bear sighting was in the -2.7% spread between increase and decrease (purple line), the first bearish signal from households since July 2020 (-1.8%) and the largest since the Coronavirus first burst onto the scene in March 2020 (-8.9%).

Granted, households aren’t the best predictors. That said, in the four years through 2019, the Conference Board’s stock market expectations spread had a .74 correlation to the S&P 500’s trailing 12-month performance. Since then, however, that co-movement has slid to .22, with the benchmark index far outpacing consumer expectations. For that, we have the power of passive investing to thank juiced as never before by record levels of monetary and fiscal stimulus injections.

Consumer stock market expectations has a higher beta than income expectations (orange line). This holds intuitively given equity volatility comes with the territory of trading shares week in and week out. Meanwhile, paychecks, the basis for income expectations, are generally more stable for hourly workers and, especially, for salaried workers. Despite one making more noise than the other, income expectations has a .61 correlation to stock price expectations since the latter’s inception in 1987.

For asset holders up the income distribution, gains in the stock market are akin to income gains. Managers that get paid in shares reap the benefits when the wind is at the back of their firms’ stock price. When the broader market is rising, it also strokes the psyches of upper-income individuals.

Notably, income expectations has cooled, but not as much as stock price expectations concurrent with households’ uncertainty around buying plans for autos and homes rising to above normal levels. The green bars combine the responses the Conference Board asks directly of consumers; ‘uncertain’ is one of the choices under the auto and home buying plan questions. It’s no secret that higher prices have thwarted big-ticket purchases for homes and sport utility vehicles. The upshot: uncertainty with the capacity to further constrain demand.

From consumers’ perspectives, all is not for naught. The travel recovery continues unchecked: In October, 47.6% of consumers signaled they intended to take a vacation within six months, the highest since the pre-COVID month of February 2020, when 54.9% indicated the same. Per Smith Travel Research, these intentions have been realized. Since March, hotel occupancy has expanded at double-digit year-over-year rates for 31 straight weeks; average daily rates have by grown by more than a 30% annual pace since April.

Delving into the weeds, the Conference Board survey revealed fewer than normal consumers opting to board planes offset by appreciably more Americans taking to the open roads. Most intriguingly was the “other means” of travel, which vaulted to the second highest on record in October (yellow bars) behind the record high of February 1996, the month of that year’s blizzard.

“Other means” probably don’t mean tram cars on incline railways in the heart of the Smoky Mountains. But they can include passenger trains, boats, recreational vehicles (RV) and rentals vehicles. These last two are illustrated by the blue and red lines, respectively, in today’s right chart. Post-pandemic purchases of other RVs surged and will likely be deployed for excursions over the next six months. Vehicle rentals flag a parallel bullish sign. As encouragingly adventurous as these are, bearish signals on the stock market, cooling income expectations and auto and home buying uncertainty will outweigh the positivity of travel in the larger consumer spending mosaic.


If I Could Turn Forward Time

VIPs

  • Per the ifo Institute, at -4.6 points, German business expectations were decidedly below trend in October after running an above average 13.4 points in June; the 18-point swing in 4 months has historical comparisons only to the pandemic’s onset and Great Financial Crisis
  • ifo’s Business Cycle Clock, which tracks German business conditions and expectations, was in the “slowdown” quadrant for a second straight month in October; this is the first year that has seen all four quadrants traversed on account of the pandemic’s cycle hyper-compression
  • China’s manufacturing New Orders-Inventories spread has slowed, helping temper German business expectations; a continued slowdown in activity could lead ECB policymakers to turn dovish just as the Fed begins its tapering efforts, piling onto euro bearishness


Some songs will forever be more recognizable on the silent screen. Cher’s 1989 MTV mega-hit “If I Could Turn Back Time” fits that bill. The video was filmed on board the U.S.S. Missouri while it was stationed at Pier D in the former Long Beach Naval Shipyard for routine maintenance. In a December 2013 interview with Q magazine, Cher recalled of the multiple days of filming: “There was a whole story – I climbed up stuff, I was running away from a lover. I was in a cage, in a speedboat…And when the director got to the edit, he just said, ‘F this, here’s the money (shot)’ – me on the battleship with the sailors. They were real sailors too. They were funny. They kept calling me ma’am.” It was Cher’s outfit – fishnet body stocking under a black one-piece bathing suit exposing her butterfly tattoo – that proved most controversial to television networks, to say nothing of the Navy, which expected Cher to wear a jumpsuit instead. MTV initially banned the video…

It may have felt as if time was turned back when the pandemic first hit when comparisons to the 1918 Spanish Flu were prolific. More than a year after COVID-19 involuntarily locked down the world, we reflect on the flash recession that was the shortest and deepest ever recorded. The thing is, the pandemic didn’t just turn back time, it also propelled it forward. Add one part “shock of a temporary nature” to “unprecedented policy response of 42.3% of GDP inside 18 months” and you arrive at the cycle compression narrative. The U.S. economy, for instance, has moved much more quickly to a mid-cycle phase according to a majority of fund managers. Other economies might even be further along in the sped-up process.

As flagged yesterday, Germany is case in point. Its most important business survey indicated that the German economy has clouded over. The market-moving report for October was titled, “Supply Problems Weigh on ifo Business Climate.” And the ifo Institute had some straightforward observations: “Skepticism is increasingly evident in expectations. Companies’ assessments of their current situation are also less positive. Supply problems are giving businesses headaches. Capacity utilization in manufacturing is falling. Sand in the wheels of the Germany economy is hampering recovery.”

Surprise, surprise — supply bottlenecks were singled out for the underperformance in the manufacturing and trade sectors. But the deterioration in business expectations was also evident in the service sector too. In a world of artificially suppressed interest rates, the construction sector saw the only sector which saw more optimism on tap.

The most interesting graphic in the report was the ifo Business Cycle Clock, depicted as our left chart. For those not familiar with the concept, the clock shows the cyclical relationship between the current business situation and business expectations in a four-quadrant diagram. The scatter plot of economic activity passes through quadrants labeled with the different phases of activity – recovery, boom, slowdown, and crisis. If survey participants’ assessments of the current business situation and their business expectations are both below average, economic activity is plotted in the “crisis” quadrant. If the expectations indicator is above average (with an improving but below average business situation), economic activity moves to “recovery.” If the business situation and expectations are both above average, economic activity lands in the “boom” quadrant. If, however, the expectations indicator falls below average (with a deteriorating, but above average, business situation), economic activity slips into the “slowdown” quadrant.

To recap 2021, January and February put Germany’s economy in the crisis quadrant. Over the next three months through May, the economy progressed into the recovery quadrant. In the summer months through August, a boom commenced. Drum roll (not really…), we’ve segued into a slowdown. At -4.6 points, business expectations moved decidedly below trend in October after running at an above average +13.4 points as recently as June. The 18-point pendulum-swing compares only to periods during the Great Recession in 2008 and the flash pandemic recession of 2020. Notably, October marked the second month in the slowdown quadrant.

This signifies the dramatic cycle compression that’s fast manifesting as a global phenomenon. This year is the only in which the ifo Business Cycle Clock raced through all four quadrants, an unprecedent if there ever was one in the 16 years since the series’ 2005 inception. Bear in mind, the ifo business measures cover the whole economy encompassing manufacturing, trade, services and construction.

As we’ve emphasized in tandem with slowing (Tesla’s blowout sales day excluded) U.S. car sales, the demand slowdown is more than a supply chain story. Part of the disappointment in German business expectations is fundamental, tied to China’s driving Germany’s industrial sector. The slower signal from China’s manufacturing new orders-inventories composite indicator (red line) tells us all we need to know about the turnabout in Germany’s business expectations (green line).

German executives probably wish they could turn back time. Alas, the cycle has instead been hyper-driven into a slowdown. A further stay in the bottom right quadrant could lead European Central Bank monetary policymakers to squawk dovish at a time when the Fed is readying its taper terror. The foreign exchange outlook for the U.S. dollar was bullish before stemming from the difference in central bank policy guidance. A German slowdown with legs would pile on euro bearishness and heighten conviction in a dollar bull call.

Progeny is Destiny

VIPs

  • Though Australia’s Supplier Deliveries are at record highs, they remain below the rest of the developed world; in the U.S., should there be strike threats at the ports of Long Beach and LA following the 90-day surge, regional delivery time expectations should remain elevated
  • Production-related factors contributed just +0.11 to the Chicago Fed’s National Activity Indicator in August vs. +0.40 in July; though the Fed may be forced to accelerate tapering should the supply chain push up prices, tightening into a slowdown could prove devastating
  • Despite low supplies, copper’s drop last week was the largest in four months, validating the fast-spreading industrial slowdown; meanwhile, bottlenecks continue to threaten earnings prospects, as only two of eleven S&P 500 sectors have seen EPS forecasts rise in October


There are two times in life when who you know makes nary a difference. Birth is the first of the two. In the case of John Batman, the firstborn child of William Batman on January 21, 1801 in New South Wales, the stain of his father’s being an ex-convict would forever haunt him. At the age of 15, John was apprenticing a local blacksmith, James Flavell. On November 4, 1816, Flavell and William Tripp, were sentenced to hanging for stealing clothes from a neighbor’s home. Set aside the irony of colonial Australia’s harshness on petty criminals; it was witness John Batman who testified to convict his employer, sending him to his death, an act emblematic of the son-of-a-convict stigma he endeavored to shed. There’s little doubt Batman left his mark on Australian commerce. On May 10, 1835, he chartered the Rebecca, a 30-ton sloop launched the year before, and sailed from Launceston, Tasmania to Port Phillip, where he landed May 29th. One week later, Batman entered a treaty with the aboriginals for use of their land to build a great city around a formidable port.

On September 18, 2016, a consortium backed by investors including China Investment Corporation, agreed to buy the Port of Melbourne, the country’s busiest, for $7.3 billion; the deal was packaged as a 50-year lease. This past May, Australian defense officials opened a review into whether a 99-year lease granted to Shandong Landbridge Group in 2015 to operate the smaller Darwin Port for $392 million posed a national security threat. Per the Wall Street Journal, “The port handles ammunition, equipment and fuel used by U.S. Marines and the Australian troops who train with them for up to six months of the year. It’s also the most suitable site in northern Australia for a major naval base and provides the country’s closest route to disputed South China Sea waters.” Did we mention the times are changing?

The globality of trade that’s induced the “bottleneck recession,” as it’s now called, has raised the study of port operations and efficiency to a new level. In the case of Melbourne, rising COVID-19 cases and striking workers have exacerbated the ongoing supply chain disruption. As you see in today’s left chart, though Australia’s delivery times are at record highs, they’re nowhere near as lengthy as those of the Euro Area, the U.K. and the United States.

Nowhere is the threat of a similar strike to the ongoing one across Australia’s ports more potentially damaging than at the U.S. West coast ports. On October 13th, Biden announced that Los Angeles and Long Beach ports will run a 24/7 “90-day sprint” while the biggest couriers and retailers will expand their hours to help alleviate congestion and presumably save the holidays. While his observation that “all of these goods won’t move by themselves” is sound, the concessions made by the International Longshore and Warehouse Union (ILWU) will likely carry a stiff price this coming summer.

According to the Journal of Commerce, the ILWU, whose “members (are) receiving the highest wages and benefits among U.S. unionized workers” and have instigated slowdowns during nearly every negotiation back to the 1990s, the lead time up to the July 1, 2022 expiration of the contract currently in place will entail more than demands for higher compensation. Per the Journal, “The union may go further, possibly seeking to roll back employers’ automation rights,” which has been expedited greatly since the pandemic hit and rightly considered an existential threat by the ILWU.

Expectations that supplier delivery times (orange line) six months out will be sustained at historic highs would intensify should headlines about the possibility of a strike proliferate after the 90-day sprint has crossed the finish line. The specter of persistently high inflation stemming from freight costs would continue crippling the industrial sector. A Bloomberg economics analysis found that if supply chain challenges force goods prices up by 5% in June 2022 compared to September 2021, the Fed would be forced to accelerate its pace of tightening.

The only catch is that the Fed cannot tighten into a slowing economy. This morning’s Chicago Fed National Activity Index (CFNAI) for September may flag an emerging industrial recession. In August, production-related indicators contributed +0.11 to the index, down from +0.40 in July which clearly pressured the headline which fell +0.29 vs. +0.75. We will also wake to today’s IFO release for October, due out at 4 am EST. The expectations series is the most closely watched gauge of German business confidence and hit a five-month low in September.

Despite low supplies, perhaps copper’s slide by the most in four months last week validated the fast-spreading industrial slowdown. As headlines about rising COVID-19 cases in China hit, copper and the industrials metals complex continued to weaken in Asian trading overnight.

The ramifications of these severe bottlenecks directly effect profits’ prospects. According to Citi’s Lorraine Schmitt, a longtime friend of QI, only two of the 11 S&P 500 sectors have seen their earnings per share forecasts raised in October. In the meantime, the Levkovich Index, which we’ve known as the “Panic/Euphoria” index all our careers, rose last week and remains in euphoric territory even as the Cyclical Expectations Index fell. The one tentative flash of positivity was freight rates per 40-foot container between Shanghai and Los Angeles ticking down from September 16th’s high of $12,424 to $10,898.