
VIPs
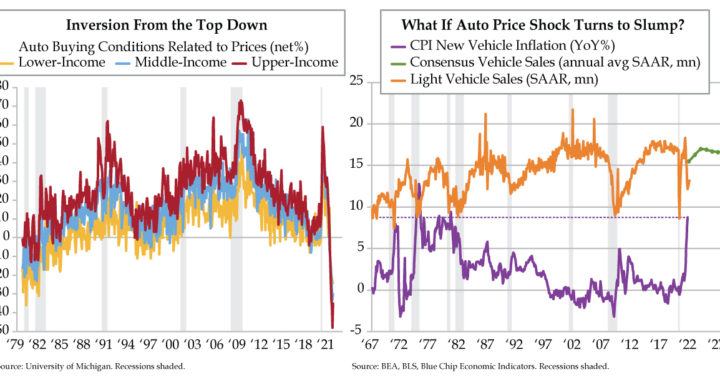
- Lower, middle, and upper-income cohorts all had net pessimism regarding auto buying conditions, at -24%, -30%, and -35%, respectively, in October, per UMich; upper-income buyers have been the most pessimistic group in the last three months, not seen since 1981
- Since 1967, the correlation between CPI new vehicle inflation and new vehicle sales has been -0.47, with sales tending to rise when price rises moderated or fell; at roughly 9% YoY, current new vehicle inflation calls back to the 1970s, when sales ran at a 5-10 million SAAR
- Though October sales bounced back slightly to a 12.99 million SAAR, the downtrend since April’s 18.3 million still has room to run; the stellar bounce back to 16.3 million SAAR in 2022 is predicated on supply chains normalizing & demand not having been pulled forward
“If it looks like a duck, swims like a duck and quacks like a duck, then it’s probably a duck.” Attribution for the phrase goes to the “Hoosier Poet” James Whitcomb Riley of Greenfield, Indiana. In 1849, he wrote: “When I see a bird that walks like a duck and swims like a duck and quacks like a duck, I call that bird a duck.” Over the years, this declaration has morphed into the so-called “duck test,” a form of abductive reasoning to determine the nature of an uncertain thing or situation, usually in the absence of, or in spite of, concrete evidence. The duck test’s logical inference starts with an observation or set of observations and then seeks the simplest and most likely conclusion from the explanation.
Does the duck test apply to price shocks? Over the course of U.S. business cycle history, the most convincing price-shock duck test coincided with spikes in crude oil prices. The Arab oil embargoes that generated the energy crises (plural) of the 1970s have a place in the history books – and get a passing grade, for sure. The Iraq invasion of Kuwait which ushered in the Gulf War and the 1990-91 recession saw oil prices double from $20 per barrel to $40 and also meant there was a high probability that we had a small aquatic bird of the family Anatidae on our hands. In all cases, prices at the pump surged, and the most visible price in the U.S. economy, that of retail gasoline, created the pain point for purchasing power.
What about an auto price shock? Sure, consumers are now able to view prices more readily than in past economic cycles with the advent of the information age and price transparency by auto manufacturers and auto dealers. Who hasn’t used cars.com or Kelley Blue Book or Edmunds?
But an auto price shock wouldn’t and couldn’t generate the buy-now mentality and urgency of an oil shock. Gasoline is a high frequency purchase measured in weeks. Auto-buying frequency is measured in years. Buyers observe prices and price movements more frequently with the former than the latter. That said, this statement is disproved in today’s left chart.
The entire income distribution has coalesced around the vehicle price narrative. Prices have become such an impediment to buying conditions that lower-, middle- and upper-income households all indicate that it’s a bad time to buy. For the past six months, there have been fewer respondents stating it was a good time to buy because of low prices relative to those who said it was a bad time to buy due to high prices. As recently as March, all three groups registered optimism with regard to prices: lower at 4%, middle at 9% and upper at 13%. In October, pessimism reigned: lower at -24%, middle at -30% and upper at -35%.
The most unique thing about the past three months was that upper income buying conditions related to prices were worse than both the middle and the lower tiers. This inversion from the top down in August, September and October was only equaled one other time in history: November 1981. For perspective, the biggest earners are the biggest spenders when it comes to new vehicle consumption. About 60% of cars and trucks are bought by the top-third, roughly 30% by the middle-third and around 10% by the bottom third, according to the Bureau of Labor Statistics’ 2020 Consumer Expenditure Survey.
Since the late 1960s, new vehicle inflation has been inversely related to new vehicle sales. The correlation between the right chart’s two series has been -.47 since 1967. This mirror image chart shows automakers consistently sold more product when price increases were moderate (between 0% and 5%) or declining. Current consumer price inflation for new vehicles around a 9% year-over-year rate harkens back to the 1970s, when sales trended between a 10 million to 15 million seasonally adjusted annual rate (SAAR). At the extreme, inflation above 9% led to a sub-10 million SAAR.
A cross check with the first chart’s outlier – November 1981 – lead us to ask: “What if auto price shock turns to slump?” What followed the inversion in the income distribution back then was a capitulation at a lower SAAR. In the 12 months that followed November 1981, sales averaged 10.2 million. Even though we saw a slight bounce in October sales to an unrounded 12.99-million SAAR rate, if history repeats itself, the downturn that started from April’s 18.3 million SAAR still has room to run.
To be sure, persistently high auto inflation would have to hold to generate a persistent sales slump. Whether we have all the details correctly placed in the current risk scenario is a moot point. What we do know is that the consensus anticipates a bounce back in the SAAR from 15.5 million in 2021 to 16.3 million in 2022 to 17.0 in 2023 before leveling off in the high 16s out to 2027. Underlying that medium-to-longer run outlook are two assumptions – shockingly high auto prices will fall back as the supply chain normalizes in the next two years and that unprecedented levels of stimulus-spending have not pulled forward an unparalleled level of demand.
A duck test for a slump in auto demand due to high prices only can be harvested over the next year. At least we know the consensus is pricing for the opposite to occur.