Inflation Re-Harkens the Specter of Bankruptcies

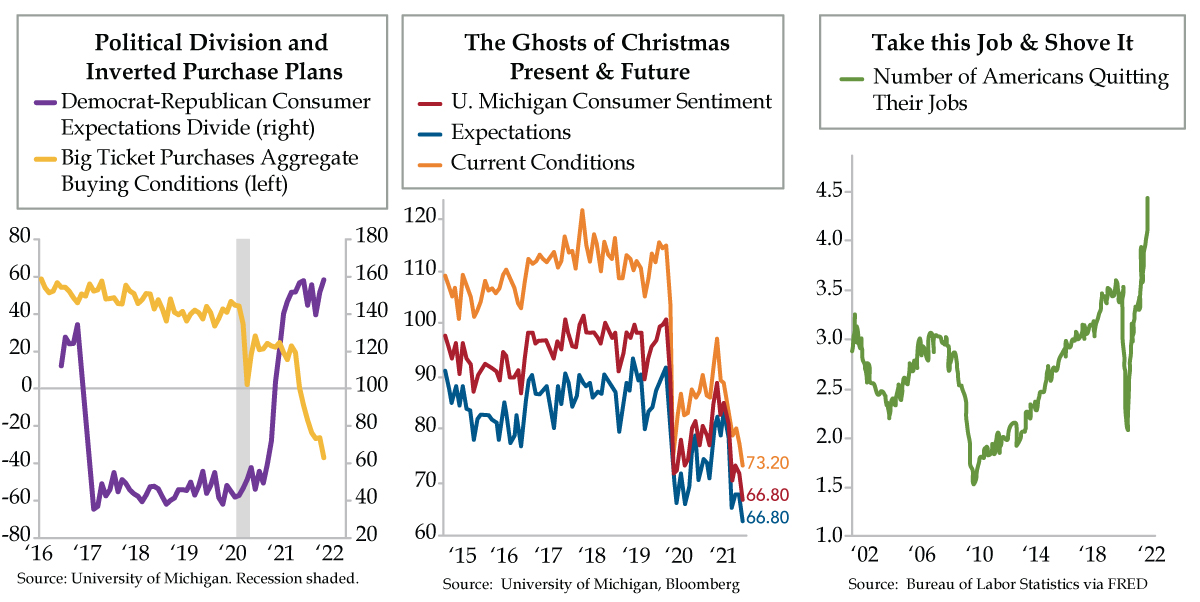
QI TAKEAWAY —   “Transitory” inflation is now catalyzing bankruptcies in America. As much as we hear about the bravado of job hoppers, job losses necessarily follow companies going out of business. The ‘stag’ in stagflation is rearing its ugly head. We know we’ve been swimming upstream for months against the tide of buyside and sell-side steepening calls. We remain comfortable with our call.

  1. Bankruptcy filings for companies with at least $50 million in debt hit three in the week ended November 12 vs. nearly 15 seen in June 2020; though the Fed’s credit backstop limited creative destruction, corroded supply chains are pressuring firms that survived the pandemic
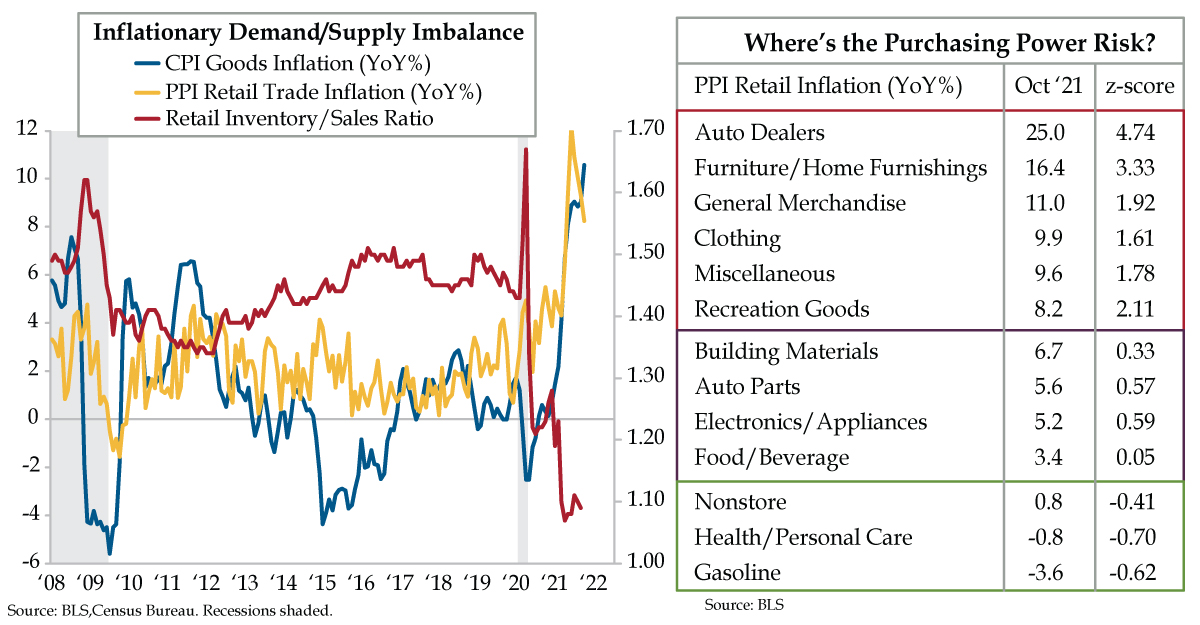
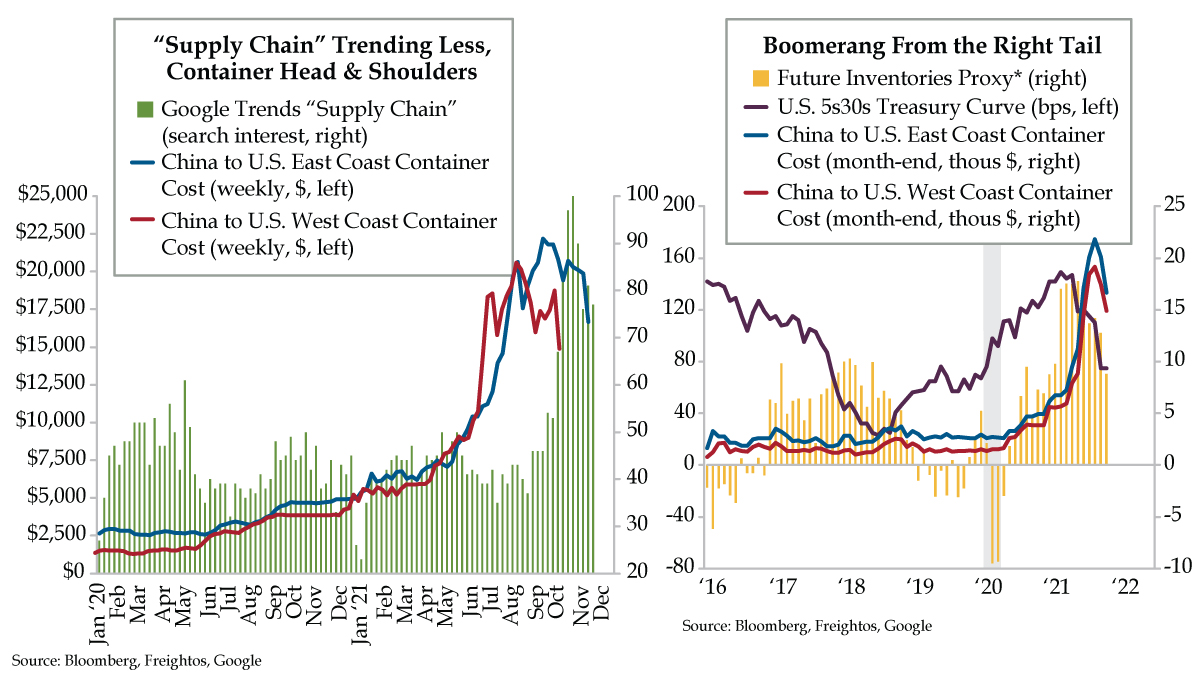
  2. An average of Future Inventories from regional Fed surveys suggests that panic buying by firms has subsided; the same message, which harms future GDP math, can be seen in the tightening of the 5s/30s curve corroborated by a decline in Google “Supply Chain” searches
  3. Per Freightos, container costs from China to the US’s East and West Coasts have finally begun to turn; should the downward trend continue, prices may begin to fall back down to Earth for consumers as well as for businesses struggling to manage elevated input costs

Households Hitting Budgetary Breaking Point

QI TAKEAWAY —   Consumer Discretionary has been on a tear, fueled by aspirational buyers and those on the receiving end of the Fed’s trickle up policies. Taking some profits in the sector could prove prudent.

  1. Per Bank of America, the percentage change in inflation-adjusted grocery spending on a 2-year basis slipped further into contraction in October; while food inflation appears to be leveling off at high levels, per the CRB, higher prices are driving nominal gains in card spend
  2. On an inflation-adjusted basis, growth in goods spending reached a massive 40% last spring, while a third stimulus check helped boost services spending 20%; against the current pricing backdrop, UMich Real Household Income Expectations in 1-2 years are now at 5-year lows
  3. The aggregate of Current Inventories from the NY, PHL, and KC Fed’s manufacturing surveys, as a z-score, is just below a 20-year high; meanwhile, Current Prices Paid continue to push upward as demand pulled forward exacerbates ongoing supply chain challenges

Caveat Emptor: Keep Building

QI TAKEAWAY —   Home builders have property appreciation at their back to mathematically justify keeping the building machine up and running. A shift to supply conditions north of long-run averages could, however, flag a move out of the right tail for pricing power after an impossibly long run of undersupply that’s left most investors in the sector vastly unprepared.

  1. New homes under construction rose to 1.451 million in October, eclipsing the 2000s peatilk of 1.426 million circa March 2006; the last time units under construction were higher was the 1970s, though the current boom critically lacks the same underlying population growth rates
  2. Unsold existing single-family home inventories sit at 2.4-months, a record low with no prior reading below 3 in data back to 1982; meanwhile, the undersupply of new single-family homes in 2020 has given way to prints closer to the long-term average of 6 months in 2021
  3. A record 28% of new single-family homes for sale are “Not Started” – a massive backlog of unbuilt homes; however, with buying conditions, per University of Michigan, inverted for the first time since the 1980s, demand will be challenged by the high pricing environment

Defense Wins Championships

QI TAKEAWAY —   Retail sales are being inflated by pervasive demand/supply imbalances that could morph into challenged consumer purchasing power. We get that our call against consumer discretionary has been way too early, and therefore costly. But that can’t take away from the new element of a lack of stimulus spending coupled with the dual capitulations of rental evictions and inflation that’s choking working U.S. households’ budgets. And we’re only 17 days away from the McConnell debt ceiling moment even as Biden has announced he’ll name his choice for Fed chair on a Saturday, when markets are safely closed for trading. Paring more cyclical consumer positions might be a prudent course of action.


  1. October’s 1.7% MoM retail sales print was the largest since March and more than four times greater than the 0.4% long-term average; however, given these are nominal terms, deflating them using the CPI shows real retail sales remain 6% below March’s post-pandemic high
  2. At 1.09, September’s retail inventory/sales ratio hovered just above April 2021’s record low 1.07 print; prior to the pandemic, this metric had never fallen below 1.3, with fiscal stimulus helping to drive a persistent supply/demand imbalance and pull forward consumer spending
  3. PPI retail trade inflation, though off its June peak of 12.2% YoY, remained high in October at 8.2%; as z-scores, retail inflation is rising at above-trend rates in six sectors, notably autos, furnishings, general merchandise, clothing, miscellaneous goods, and recreation goods


Long Transports

QI TAKEAWAY —   Record freight cost inflation is safeguarding transportation stocks’ prospects despite a slowdown in shipment volumes.

  1. Cass freight shipping costs saw a 36.2% YoY gain in October, the largest on record, as supply chain disruptions persist; though logistics costs have surged, shipment volume has calmed thus far in Q4 to a 0.8% YoY advance vs. the 29.9% and 9.1% gains of Q2 and Q3
  2. The American Trucking Association estimates that the trucker shortage will exceed 80,000 drivers by year end 2021; pandemic scarring has also exacerbated the issue, with more than 3,000 trucking companies shuttering last year, per Broughton Capital, up from 1,110 in 2019
  3. September’s JOLTS saw 589,000 job openings in transportation, more than twice December 2020’s 277,000; this pushed openings to 8% of total sector employment, all while paychecks for long-distance freight trucking rose a record 11.9% YoY vs. the 2.5% long-term average

Fear Overcomes Bravado

QI TAKEAWAY —  The inflation hysteria is hard to ignore. The slowing economy in the background, however, commands a louder message. We appreciate how far behind the curve the Fed is. That’s precisely why we reiterate our flattening call originated May 10th, when the Street was ALL IN on the steepener trade. The economy slowing sans the fourth stimulus check trumps all other factors to the plus side.

  1. The record 4.3 million U.S. workers who quit in September total 3.0% of total employment, a sign of increasing worker confidence; geographically, quits were highest in the South at 3.3%, and were outsized in food/accommodation and arts/entertainment at 6.6% and 5.7%
  2. Though off a record high 7%, job openings still remain at an extraordinarily high 6.6% of total employment; however, per UMich’s most recent survey, Current Conditions slumped to 73.2, an August 2011 low, while Expectations slid further to 66.8, an October 2013 low
  3. Buying conditions for household goods slipped to a 78 in UMich’s latest read, the lowest since 1978; and despite a record number of quits, one in four households anticipate being worse off in 12 months and the Democrat-Republican expectations divide hit a new high

Fading the Housing Inflation Hysteria

QI TAKEAWAY —  Overbuilding is as foreign a concept as any investor can conceive given the undersupply that’s weighed on the housing market for the past decade. Investors should, nonetheless, prepare themselves for this inevitability as the stars align given the confluence of overbuilding into an over-invested MSA backdrop.


  1. Per CoreLogic, Memphis is the most desirable housing market for investors, with the rest of the top 10 spread across the South and Mountain-West; conversely, the least attractive housing markets for investors, save for two cities in Louisiana, are in the Northeast
  2. Pre-pandemic moratorium, Memphis historically had one of the highest eviction rates of any MSA at 6.1%; this suspension of lower-end supply sent rent inflation 19% over the 2014-2020 trend-line, but as evictions resume, new supply should give a reality check to investors
  3. The share of employees working from home has now fallen from 35.4% of the workforce in May 2020 to just 11.6% last month; with investors doubling down on their housing market purchases in spite of this, oversupply could soon apply pressure to an overheated market


Inflation Reaches a Fevered Pitch

QI TAKEAWAY —  The bond vigilantes were back out in force in the U.S. Treasury market yesterday. Echoes of the 1970s from the core CPI ratify the rational response from the inflation surprise. However, nondiscretionary inflation, the kind that cannot be avoided, is part of the run up – and will act as a governor on growth from the lowest rungs of the income distribution upward. Though great political optics, calls for the Fed being behind the curve might be offsides.

  1. Both the MoM and YoY changes in the CPI and core CPI exceeded every estimate by economists in Bloomberg’s survey; the surprise generated an up-shift in the U.S. Treasury curve, with the greatest bulging seen at the 5-yr point as the 5s30s curve flattened < 70 bps
  2. In the last five months, six-month annualized core CPI has run between 5.9% and 6.8%, not seen since the early 1980s; with this shorter-run trend running hotter than the YoY pulse, core CPI inflation forecasts are likely to be revised upward from the current 4.6% annual rate
  3. QI’s Household Budget Inflation Gauge rose to a 6.4% YoY rate in October, the highest since the Great Recession; while wages for non-manager workers has risen from April’s 1.1% to 5.8% YoY in October, the HBIG has outpaced wage gains in five of the last seven months

1970s-Style Pipeline Pressures

QI TAKEAWAY —  Persistent pipeline pressures risk a slowdown in the most visible leading indicator – U.S. ISM Manufacturing New Orders. Main Street has already sniffed out this risk and is endeavoring to raise prices to defend against stalling revenue and profit headwinds. We re-repeat, a curve-flattener is still the most likely outcome.


  1. PPI inflation for intermediate goods has exceeded the same metric for finished goods by a double-digit margin for the last six months; only the seven-month stretch from July 1974 to January 1975 compares historically, as pipeline pressures risk bleeding into consumer prices
  2. ISM Manufacturing New Orders, though still above the 50-breakeven, has fallen below 60 after a 15-month streak north of that threshold; further declines could continue to push down Small Business Expectations, already at near record pessimism due to elevated uncertainty
  3. In the NFIB October survey, a record 51% of small business owners said they plan to raise prices in order to combat higher material, transport, and labor costs; with core PCE printing at 4.4% vs. the 2% target, the latest CFO Survey also validates the rising input cost dilemma


Opening Borders & Upping Profits in Lodging

QI TAKEAWAY —  Econ 101 dictates that opening borders could mean a smaller ‘C’ for travel spending shifted to a larger ‘X’ for travel services. Hotels stand to gain from additional foreign travel but should keep cost-saving initiatives in place all in the name of productivity and profits.

  1. The S&P 500 Basic EPS Hotels was never negative until 2020, and has stayed in contraction for the last seven quarters; despite their historically tight correlation, hotel occupancy has recovered to pre-pandemic levels while hotel profits lag on account of higher input costs
  2. Since bottoming out in April 2020, hotel workers have seen their aggregate hours worked recover 111%; meanwhile, linen/uniform supply workers have only risen 38%, diverging from the former as services previously contracted out are brought in-house to cut costs
  3. Per Cirium, airlines are increasing flights between the UK and U.S. by 21% MoM as U.S. borders are re-opened to vaccinated travelers; inflows from nonresident travelers should drive service consumption, though this will manifest in GDP accounting as export services