Home Improvement Continues to Improve

QI Takeaway  —  The Fed’s QE has underpinned the home improvement sector. After COVID-19, this corner of residential real estate swelled to a record share of GDP – and it probably won’t stop there. Home price appreciation in high rent districts have underwritten the expansion, and top-end households have benefitted the most allowing for a sustained renovation cycle.


  1. From zero in 2008, the Fed has expanded its holdings of mortgage-backed securities to $2.54 trillion in September 2021; the Fed’s MBS holdings are tethered to housing proxy Sherwin-Williams, which has seen its stock price double since expanded QE began in March 2020
  2. The average mortgage loan size for adjustable-rate mortgages totaled $977,400 in September, $661,000 higher than the $316,400 for fixed-rate mortgages; this spread was roughly $200,000 in 2008 before QE began and higher-priced homes saw faster price appreciation
  3. As a share of GDP, home improvements have hit record highs of 1.4-1.5% post-pandemic, exceeding the 1.3% not surpassed since the series’ inception in 1959; multi-generational households have become more common as would-be new buyers have been priced out

Hot Mulled Cider Day Is Upon Us!

VIPs

  • From zero in 2008, the Fed has expanded its holdings of mortgage-backed securities to $2.54 trillion in September 2021; the Fed’s MBS holdings are tethered to housing proxy Sherwin-Williams, which has seen its stock price double since expanded QE began in March 2020
  • The average mortgage loan size for adjustable-rate mortgages totaled $977,400 in September, $661,000 higher than the $316,400 for fixed-rate mortgages; this spread was roughly $200,000 in 2008 before QE began and higher-priced homes saw faster price appreciation
  • As a share of GDP, home improvements have hit record highs of 1.4-1.5% post-pandemic, exceeding the 1.3% not surpassed since the series’ inception in 1959; multi-generational households have become more common as would-be new buyers have been priced out

A week into autumn, it’s time to embrace the (at this point, trite) pumpkin flavor of the season. Aside from being the day the U.S. government could shutter, today is National Hot Mulled Cider Day. The scents of cinnamon, nutmeg and apple incense the olfactory. Toasty mugs of mulled cider around which to wrap our (still warm from the drawn-out summer) hands around promise to snug us up from the inside out. There is, thank heavens, a history here tied to the old pagan ritual of “Wassailing.” ‘Wassail’ derives from the Anglo-Saxon ‘waes hael’, or ‘good health’. The wassail drink was made with mulled ale, curdled cream, roasted apples, eggs, cloves, ginger, nutmeg and sugar. Mulling the cider entails heating it to almost boiling and adding cinnamon, orange peel, nutmeg, cloves, and other spices. If you’re still with us and fancy a food pairing, we suggest a creamy pasta dish, gingerbread, turkey dinners, blue cheese, squash soup, pancakes, cinnamon sugar doughnuts or apple pie. Is your home warmed at the thought? Are your spirits lifted?

Asset holders’ portfolios have never been better lifted since central banks strolled down QE (quantitative easing) Lane more than a decade ago. Moreover, since the Fed’s all-in March 2020 moment, backstopping the credit markets and unleashing unlimited QE, risk assets qualify as understudies in The Untouchables.

One of the innovations of the QE era was the Fed’s balance sheet expansion into the mortgage-backed securities (MBS) market. From no holdings at the end of 2008, this line item has expanded to $2.54 trillion inside the space of 13 years. That’s the latest figure we have on hand as of the latest available week in September 2021 (green shaded areas in both charts). The unprecedented, targeted support for the U.S. housing market, especially over the last 18 months, has supercharged returns for certain securities.

Take Sherwin-Williams. The Cleveland-based global leader in paints and coatings (ticker SHW) that’s beautified the Earth for more than 150 years has seen its share price rise nearly 15 times since 2008. From the COVID-19 abyss in March 2020 to present day, you would have doubled your money. A glance at the left chart reveals the slope of SHW over the last year and a half (blue line) which was effectively painted by the Fed’s expanded support of MBS. It’s almost too obvious that the Fed put was the driver.

Why focus on a paint company? It’s a leading indicator of a leading cyclical sector. More paint is demanded when home sales are on the rise. Before they sell, homeowners touch up here and there. Some even throw a neutral color onto the walls over something bolder at the advice of their overpaid realtors.

Not coincidentally, the run up in home selling conditions to August’s record high ran parallel to SHW’s share price breaching the $300 level for the first time. For what it’s worth, the near 7% correction in Sherwin-Williams in September happened alongside the sharp 10-point drop in home selling conditions this month, a 93rd percentile event.

Paint is also a vital component of any home improvement project. Update a kitchen or a bathroom or finish a basement and you’re bound to be sampling different colors on the walls like so much artistic spaghetti. Ever the innovator, Sherwin-Williams allows renovators to order 2” x 3” color chips and/or 8” x 8” peel & stick samples to see how colors will look in the new space. How very accommodating.

Big-ticket projects are typically completed by high rent district residents. Like the longs in SHW, the Fed has had their backs too. The right chart depicts one angle into the relatively faster home price appreciation for high-brow homes. The red line illustrates the widening spread between the average mortgage loan size for ARMs (adjustable-rate mortgages) and FRMs (fixed-rate mortgages). Through September, the level of the former averaged $977,400, while the latter clocked in at $316,400, producing a $661,000 gap. That same spread just prior to QE’s 2008 kickoff was slightly under the $200,000 mark.

The upshot which scrolled across the Bloomberg terminal yesterday: Per the American Enterprise Institute, the share of FHA-backed mortgages to buy a home, which proxies homes purchased by younger and lower-income entry-level buyers, slumped to 18% this past June from 23% in March 2020, before the pandemic swept the country, and the Fed launched its ‘k’-shaped recovery campaign. That marked the lowest level since at least 2012.

One of the outgrowths of being priced out of the market is the explosion in multiple generations living under one roof. Ergo, as a share of the U.S. economy, home improvements have never been bigger. Post-pandemic, this subset of residential investment advanced to record highs in the 1.4%-1.5% range (purple line). The dashed line designates the 1.3% threshold, a level that had never been surpassed since the series’ 1959 inception. Not coincidentally, the Fed’s MBS expansion occurred in tandem to this “achievement.”

The Fed’s level of housing support is unlikely to shift into reverse anytime soon. Even if the taper of asset purchases winds down by the end of 2022’s first half, reinvest of principal payments from MBS will maintain the level of its holdings. When – and if – MBS QT (quantitative tightening) is announced, the fundamental support will change. Until then, grab yourself a mug full of hot mulled cider and toast to a continued expansion in the home improvement sector.

Double Dip Risks Rising

QI Takeaway  — Key cyclical leading indicators have departed from their traditional roles. Stagflation risk is the prime suspect. But it’s not oil that’s driving inflation expectations. Broader price pressures are weighing on demand which continues to make the case for Staples and against Discretionary.


  1. QI’s Future Inventories proxy, a composite of regional Fed surveys, at 14.2 in September, was nearly 10-times last decade’s average of 1.4; however, their correlation with ISM Mfg New Orders appears to have broken, with readings diverging over the last seven months
  2. At 86.6 in September, Conference Board’s Consumer Expectations Index rivals the depths of the COVID recession, with a read of 0.0 as a z-score; after seeing a full recovery to 111.9 in March vs. February 2020’s 108.1 print, consumers are curtailing spending for large durables
  3. 12-month inflation expectations have printed north of 6% every month this year, with the latest readings north of 2 as z-scores; though these expectations have trended with oil prices in the past, WTI’s recent spike to $75 has not been the driver of consumer pessimism

Greetings from Timbuk3

VIPs

  • QI’s Future Inventories proxy, a composite of regional Fed surveys, at 14.2 in September, was nearly 10-times last decade’s average of 1.4; however, their correlation with ISM Mfg New Orders appears to have broken, with readings diverging over the last seven months
  • At 86.6 in September, Conference Board’s Consumer Expectations Index rivals the depths of the COVID recession, with a read of 0.0 as a z-score; after seeing a full recovery to 111.9 in March vs. February 2020’s 108.1 print, consumers are curtailing spending for large durables
  • 12-month inflation expectations have printed north of 6% every month this year, with the latest readings north of 2 as z-scores; though these expectations have trended with oil prices in the past, WTI’s recent spike to $75 has not been the driver of consumer pessimism


I study nuclear science
I love my classes
I got a crazy teacher
He wears dark glasses
Things are going great, and they’re only getting better
I’m doing alright, getting good grades
The future’s so bright, I gotta wear shades
I gotta wear shades


“The Future’s So Bright, I Gotta Wear Shades” was the only mainstream hit by folk rock band Timbuk 3 and opened their debut album, Greetings from Timbuk3. Released in 1986, it climbed as high as #19 on Billboard’s Hot 100 chart. Band founder Pat MacDonald revealed on VH1’s 100 Greatest One-Hit Wonders of the 80s that the meaning of the song was widely misinterpreted as a positive perspective about the near future. On the contrary, it was a grim outlook. While not saying so directly, MacDonald hinted at the idea that the bright future was in fact due to an impending nuclear holocaust. It was a song, born during the last years of the cold war, among a smattering of predictions transcending several cultures which had foreshadowed the world ending in the 1980s.

Since you’re reading this, you’re aware those prophecies never came to pass. At last check, it is 2021. As for a bright future, it’s on display in our future inventories proxy. This forward guide for “it-girl” metric ISM manufacturing New Orders is a composite of manufacturing, services and retail future inventories indices from business surveys reported by the Federal Reserve Banks of Dallas, Kansas City, New York, Philadelphia and Richmond. Recall, the rule of thumb: “If you want to build future supply, order more today.”

How bright was September’s reading? The 14.2 figure was nearly 10 times greater than the last decade’s average of 1.4. The seven-month double digit streak culminating in September is unmatched over any span in the last 20 years. Moreover, after applying our favorite normalizer, every month in the period from March to September exceeded a 2 z-score (deviation from the mean adjusted for volatility, yellow line).

Full disclosure: We’ve used the future inventories proxy consistently as a near-term gauge for cyclical momentum in the U.S. economy. The past relationship between it and ISM New Orders provided confidence to make high conviction calls about future fundamentals. The divergence in the last seven months implies a breakdown in the connection between the two figures. A simple one-factor regression predicted ISM readings in the 70s; actual numbers were in the 60s (and z-scores were in the 1s, blue line).

A look back over history in the right chart shows that future inventories is the ‘yin’ to ISM orders ‘yang’. But not in 2021. The decoupling can be explained by the supply chain’s inability to meet demand. The persistence of future supply outperformance over current new orders means not all orders are being fulfilled. We wouldn’t go so far to call this a grim outlook like Timbuk3’s MacDonald. Instead, it’s the oxymoronic, “disappointing right-tail” problem that manifests in higher cost inflation across production and distribution channels.

Another leading indicator that’s become disconnected from the past ebb and flow of the two cyclical guides is illustrated in yellow and blue above. Since 2019, consumer expectations (red line) became unglued from the past path that tracked relatively closely to future inventories and ISM orders. Two years ago, the former was bolstered by income expectations driven by a late-cycle money grab via good unemployment (i.e., job leavers/quits), while the latter two were faced with buffeted by the trade war.

As multiple contemporary gauges corroborate, current household optimism for an economic recovery has faded. The all-clear surge in consumer expectations pushed the index to 111.9 in March, a full recovery from February 2020’s pre-pandemic level of 108.1. This month’s 86.6 print rivals the depths of the COVID recession; its z-score registered an incontrovertible 0.0. Consumers must have grown accustomed to the consistency of the stimulus checks being direct-deposited every few months.

The Conference Board noted that the “declines suggest consumers have grown more cautious and are likely to curtail spending going forward.” Households have flagged a full-on retreat in spending intentions for autos, homes and major appliances. In fact, six-month forward plans to buy a new vehicle and/or home both neared record lows in September. Sticker shock has clearly set in signaling a buyers’ strike.

The Conference Board’s tally of inflation expectations also scores points for Team Persistent. Since the calendar turned in January, 12-month forward inflation expectations have printed north of 6% in every month building in higher lows and higher highs. Translating to z-scores, the latest are running in the +2 neighborhood (purple line).

Over time, Conference Board inflation expectations and oil prices have closely co-trended. Dare we venture yet another ‘however,’ the recent run-up in West Texas Intermediate to the $75 zone translates to just a 0.5 on the z-score scale (orange line). This implication: consumers aren’t complaining about oil in the context of their collective forward view on prices. Something else is amiss.

This is where we should add that consumers perceive their future as none too bright when it comes to the key spending gauge of income expectations that’s retreated for three months running. Rising pessimism for future employment conditions, which are nearly 16 points south of their June apex, (“Fewer Jobs”) and a bottoming in the unemployment proxy “Jobs Hard to Get” also cast a late cycle glare that doesn’t require shades to shield. Double dip, anyone?

Conventionally Wise

VIPs

  • Single-family home builder confidence inched up in September, per the National Association of Home Builders, on lower lumber prices and strong housing demand; despite the optimism, the housing sector continues to face supply chain issues and labor challenges
  • Buying conditions posted a -3.24 z-score in September, well south of corresponding readings for interest rates, at -0.44, and economic uncertainty, at -0.73; despite sky-high selling conditions, the housing cycle appears to be rolling over, in light of stiff headwinds to demand
  • Purchase volumes tracked by the Mortgage Bankers Association and Optimal Blue are now back in sync for the first time since the pandemic began; with both series seeing double-digit YoY drops, the Bloomberg consensus that housing starts stay flat appears overly optimistic


Merriam-Webster defines conventional wisdom as the “generally accepted belief, opinion, judgment or prediction about a particular matter.” For instance, conventional wisdom in Hollywood says that a movie can’t succeed unless it stars a famous actor or actress. The term dates back to 1838, but more often than not, it’s credited to the economist John Kenneth Galbraith, who used it in his 1958 book The Affluent Society. Galbraith wrote: “It will be convenient to have a name for the ideas which are esteemed at any time for their acceptability, and it should be a term that emphasizes this predictability. I shall refer to these ideas henceforth as the conventional wisdom.” The two-word phrase was used throughout the text to explain the high degree of resistance in academic economics to new ideas (imagine that!).

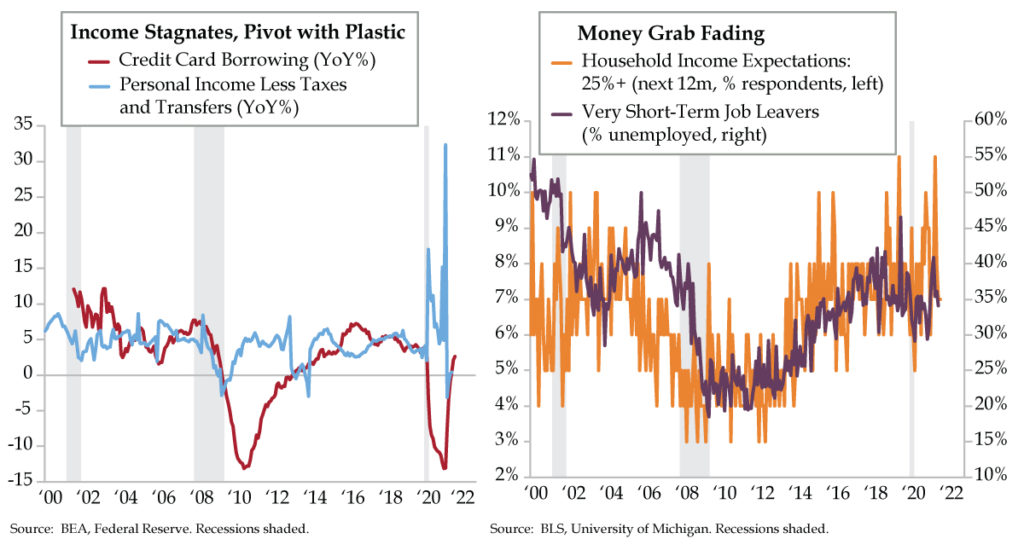
In the current economic environment, the narrative of a tight supply chain and labor market generate the mantra that supply limits demand. It’s understood that varying capacity constraints create a natural headwind to expansion. Call this the conventional wisdom of the day.

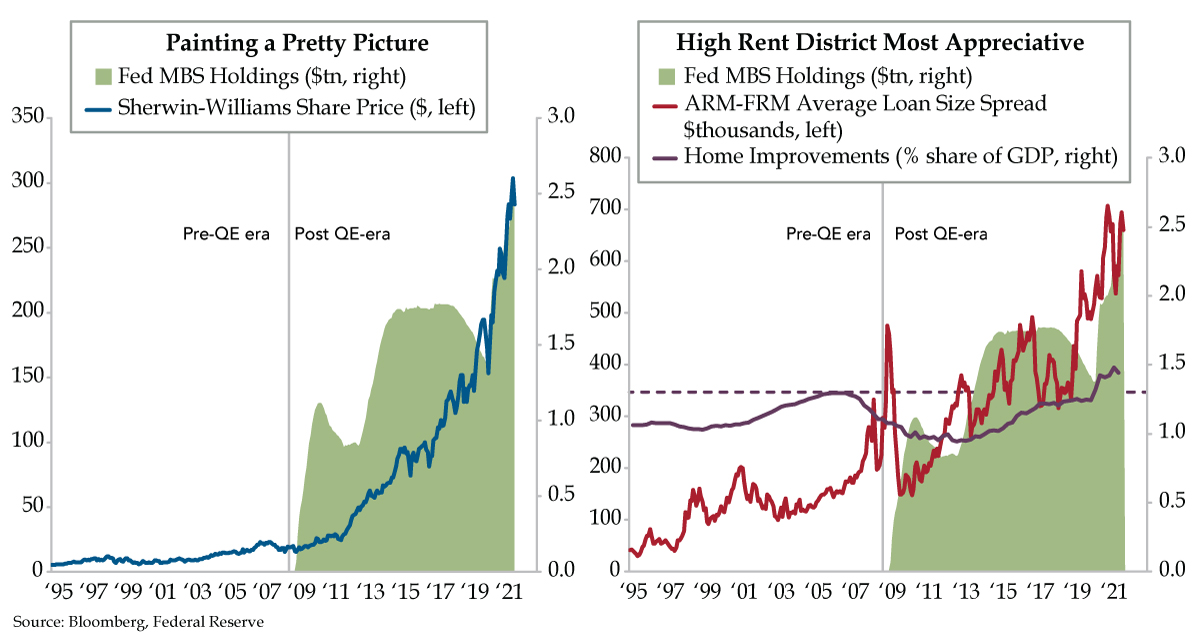
Let’s apply this to the housing sector. On Monday, the National Association of Home Builders explained that single-family home builder confidence inched up in September on lower lumber prices and strong housing demand, even as the housing sector continues to grapple with building material supply chain issues and labor challenges. Lumber prices, construction material costs and construction worker wages are easily illustrated – and have been closely watched concerns on the cost front. Strong housing demand, so the rote thinking went, was assumed.

Before digging deeper, buying a home is the largest financial commitment the average U.S. household makes. Acquiring the keys and crossing the threshold means buyers finance home purchases with residential mortgages. There are three pillars to such financed purchases: 1) prices, 2) interest rates and 3) unemployment.

Price determines the capacity to commit — there’s an inherent affordability quotient involved in a high versus low price backdrop. The former whittles buyers out of the equation; the latter fills the potential buyer pool. Because a large majority of homes have a six-digit price tag and most buyers finance, interest rates allow the interested parties to pay over a longer period of time to meet the monthly budget.

Ergo, in the ultimate analysis, unemployment dictates when the housing cycle begins and ends. To articulate the obvious, a falling trend in joblessness breeds lender optimism, while a rising path creates pessimism. Unemployment is akin to creditworthiness, and bankers slide up and down the tightening/easing scale depending on where the economic cycle is residing.

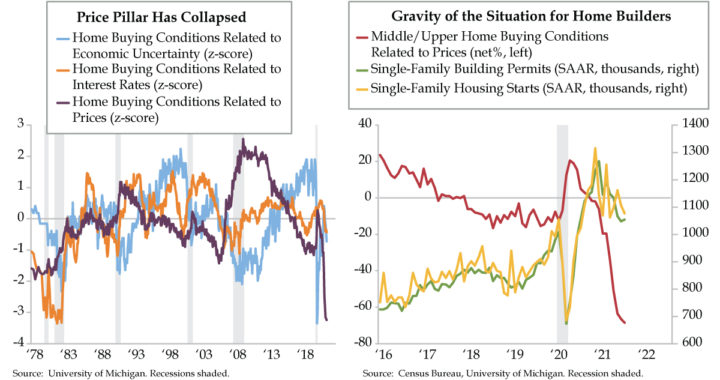
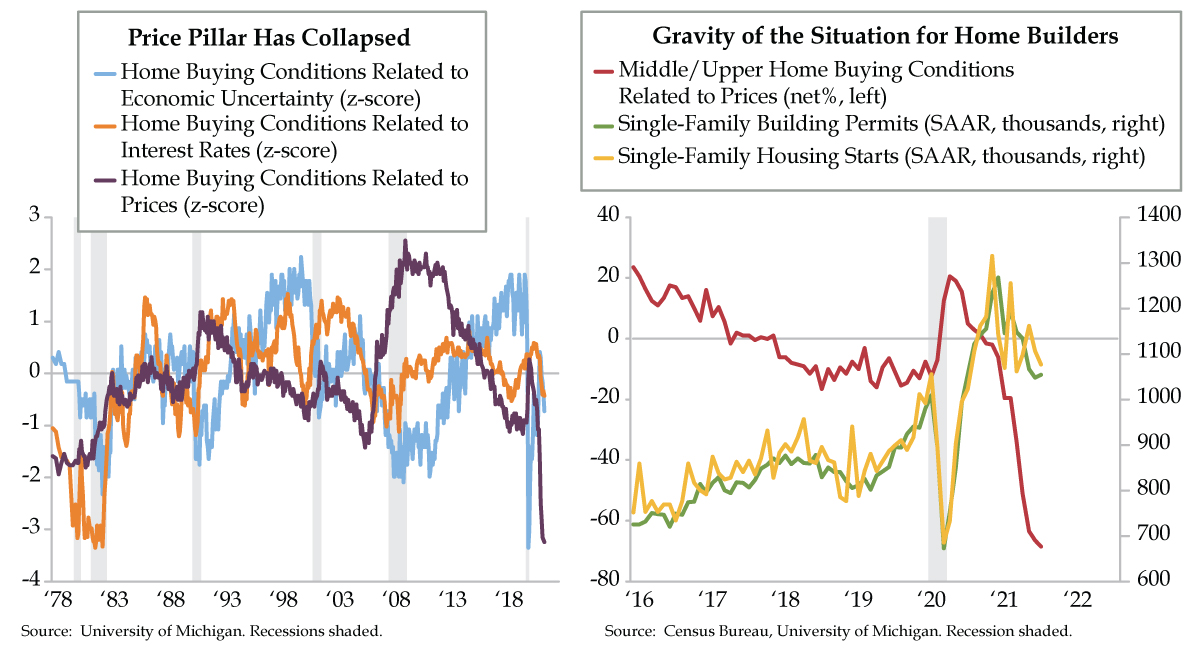
Where are we now? The price pillar has collapsed. The white hot buying conditions advanced lightning fast from reticence to successively higher highs in in 2021. The September level (purple line) printed at a -3.24 z-score (deviation from the mean adjusted for volatility), well south of that of the corresponding readings for interest rates (-0.44, orange line) and economic uncertainty (-0.73, light blue line), the proxy for unemployment.

The biggest refutation to the narrative is home selling conditions, an alternative guide to housing demand. We can’t deny that home selling conditions related to prices hit an all-time high in August. Home sellers prefer to sell in a rising market – and this market supremely qualified. But the pool of home sellers is smaller than the pool of home buyers. Homeownership rates in the U.S. are not 100%, they are closer to 65%. So, home selling conditions can never provide the whole picture.

Most owned dwellings in America are purchased by middle-income and upper-income households. We approximate about 85% of home sales are made by these two cohorts (using Bureau of Labor Statistics’ Consumer Expenditure Survey data). Since this represents the lion’s share of purchases, understanding how these buyers feel about prices in the current environment is instructive for judging niggling challenge to demand. In sum, they’ve never been more pessimistic.

The right chart depicts an aggregate indicator of middle-/upper-income home buying conditions related to prices. The plunge is historic. The gravity of the situation also suggests demand is facing stiff headwinds. If anything, the gut reaction by these buyers is postpone the purchase until prices move to your favor. Anyone have an answer when that will be?

One corroborating signal for demand is coming from mortgage application activity. Home purchase volume tracked by the Mortgage Bankers Association and from Optimal Blue are back in sync over the last six months for the first time since before COVID hit. According to the American Enterprise Institute Housing Center, both series are “the best indication of lending reality going forward”, and both are posting double-digit year-over-year declines.

Conventional wisdom from Bloomberg’s consensus estimates for housing starts project a relatively flat profile over the next four quarters. This would imply a steady revenue path over the next year for home builders. In our view, this seems somewhat overly optimistic given the unprecedented developments regarding home buying conditions that have unfolded for the biggest buyers of homes in America.

As if we needed more corroboration, QI amiga Phillipa Dunne parsed Zillow data concluding that sales were slowing, inventory was rising and more price concessions were prevalent, adding that “returning to earth from the stratosphere is likely to be a shock in some type of way, as the Zoomer kids say. From this Zillow data, it looks like reentry has begun.” We humbly concur.

Transitory, Persistent or a Third Option?

VIPs

  • The YoY trend in personal income, less taxes and transfers, has seen its forward momentum stall in recent months, per BEA data; at the same time, credit card borrowing has ramped up significantly, posting the first gains on a YoY basis since the pandemic began last March
  • At 1.6%, 12-month Household Income Expectations, per the University of Michigan’s Consumer Survey, have not yet returned to pre-COVID levels north of 2%; with current CPI at 5.3% YoY and short-run expectations at 4.7%, the hit to purchasing power is notable
  • After hitting a record high 11% in June, those expecting incomes to rise by more than 25% fell to 7% in September, in line with the long-run average; a decrease in short-term job leavers, from 40.9% of the unemployed in May to 34.1% in August, confirms the trend


The joy of parenting doesn’t come with a handbook. But certain rules of thumb that may get passed down by the generations can become good advice to follow. For example, take the idea of choice. For the rug rats in your life, psychologists recommend giving your children only two choices at a time when they want to make decisions. Kids want and expect their parents to provide structure and make key family decisions. It helps them feel safe. While it’s great to give kids a say in things, too many choices can overwhelm them or put too much pressure on them.

When reacting to inflation, it feels like the Fed has conditioned financial markets to think in two ways. It has done this by taking one side of the argument – the Fed believes inflation will be transitory. Therefore, the other side of the argument is the opposing view, inflation will be persistent.

Last Friday’s University of Michigan (UMich) consumer survey dug into households’ potential reactions to inflation. The first one was in the context of a transitory rise. In this case, consumers were seen postponing purchases and slowing spending in the months ahead. Once the temporary period of higher prices ended, consumers would resume spending at a quicker pace and a rebound would ensue.

The second reaction put inflation persistence under the umbrella of a significant fiscal and monetary expansion. Inflation psychology would develop, and greater demands for wage increases would be part of the outcome. To judge this version, however, would take time because long-term inflation expectations would have to become unhinged, not the case in the UMich survey.

UMich survey director Richard Curtin didn’t stop the discussion there. He illustrated a third option (bolding ours):

  • “The final alternative is that consumers may believe that the most effective strategy to maintaining their purchasing power is to emphasize increases in their incomes, net of taxes and transfers. The effectiveness of pandemic transfers were shown to be successful in offsetting hardships among those most vulnerable to economic disparities. Transfers to offset the inflationary erosion of living standards would be justified in a similar manner.”

The third reaction has an agnostic quality regarding the transitory vs. persistent dispute by focusing on purchasing power instead. This puts the onus on consumers to find a way to more than offset the headwind from higher prices. That can be done by increasing income, cutting household budget costs or a combination of the two.

Before exploring that, we illustrated personal income excluding taxes and transfers. What we discovered was that the year-over-year (YoY) trend has stalled in recent months (blue line). Forward momentum has essentially stopped. In its place, credit card usage has ramped up significantly (red line), posting the first post-COVID gains on an annual basis since the pandemic first hit.

Optimists would opine that the recovery in income expectations has made households more comfortable using plastic to borrow tomorrow’s income today. Pragmatists would respond that there has been progress on the income expectations front, but not substantial.

Median income expectations from the UMich survey have not returned to pre-COVID levels north of 2% despite recovering from last year’s involuntary shutdown abyss by the fall of 2020. The current 1.6% tally implies a stagnation of sorts. Since April 2021, household income expectations over the next twelve months have traveled in a tight range (1.6% to 1.9%). The hit to purchasing power is decidedly large when you factor in current inflation (consumer price index at 5.3%) or even short-run household inflation expectations (UMich one-year figure at 4.7%).

The UMich survey also illustrates how consumers can emphasize increases in their incomes. Twelve-month forward income expectations are broken down into a number of buckets: 1-2%, 3-4%, 5%, 6-9% 10-24% and 25% or more. To best offset the squeeze from prices, more consumers would look for ways to generate the biggest boost to their future income. That happens when the 25%-plus bucket swells significantly. That’s usually when more consumers opt to jump ship for better paying opportunities, much better paying. Job leavers or voluntary quits surge.

Unfortunately, this dynamic peaked in the spring and has faded through the summer months (orange line). Consumers expecting to earn 25% or more in the next year matched a record high 11% in June. By September, this guide fell to 7%, in line with the long-run average. The move away from the right tail can be confirmed by a fall back in “good unemployment.” This oxymoron defined as very short-term job leavers surged from 29.4% of the unemployed in January to 40.9% in May (purple line). It has since fallen back to 34.1% in August.

The third option of bolstering purchasing power no longer has the wind at its back from a money grab perspective. It would take another surge in workers deciding to test the waters for better pay in order to help offset the most bearish price developments in decades for buying conditions for autos, homes and home goods. Without true gains in purchasing power through the income channel, stagflation risk would continue to fester. This is a key test of the sustainability of the rebound in consumer spending.