VIPs
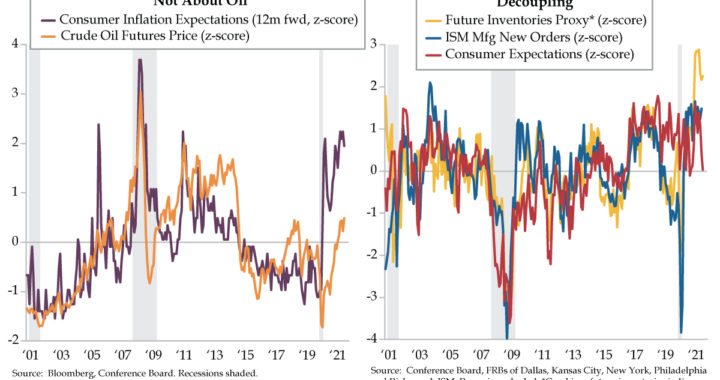
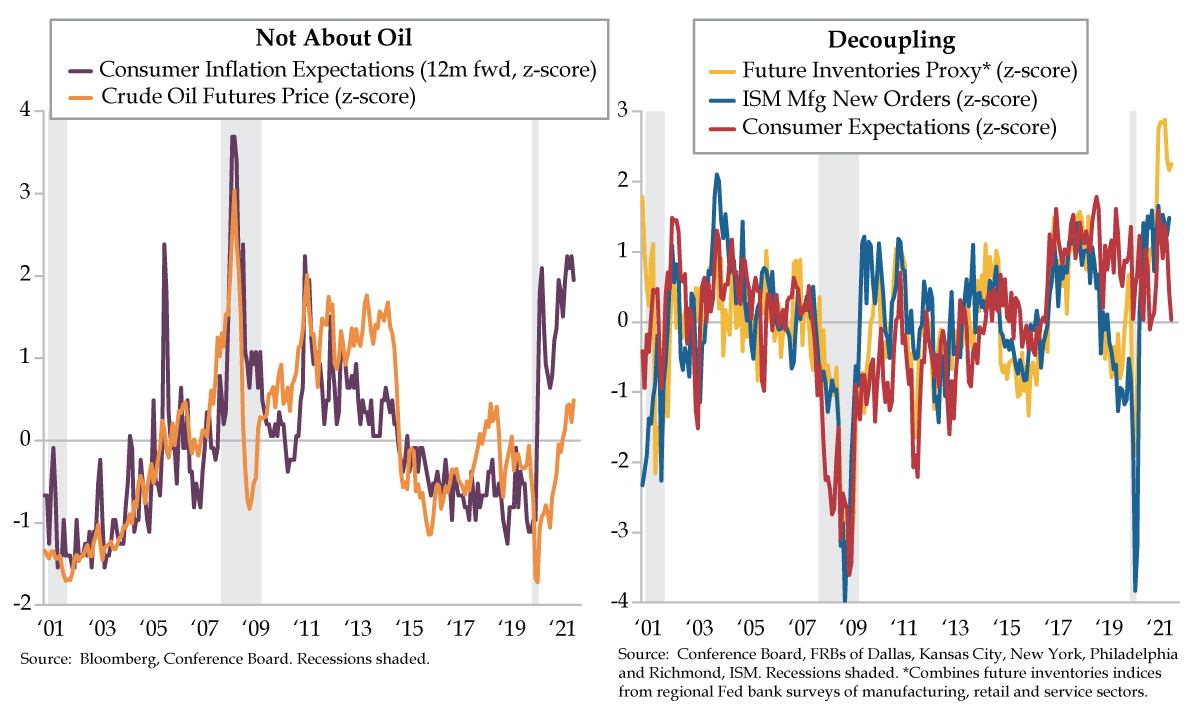
- QI’s Future Inventories proxy, a composite of regional Fed surveys, at 14.2 in September, was nearly 10-times last decade’s average of 1.4; however, their correlation with ISM Mfg New Orders appears to have broken, with readings diverging over the last seven months
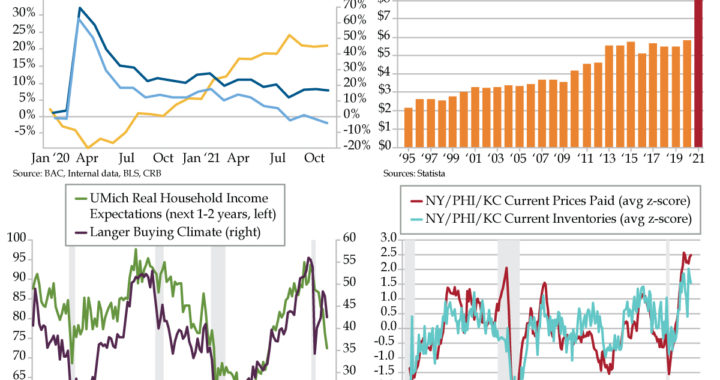
- At 86.6 in September, Conference Board’s Consumer Expectations Index rivals the depths of the COVID recession, with a read of 0.0 as a z-score; after seeing a full recovery to 111.9 in March vs. February 2020’s 108.1 print, consumers are curtailing spending for large durables
- 12-month inflation expectations have printed north of 6% every month this year, with the latest readings north of 2 as z-scores; though these expectations have trended with oil prices in the past, WTI’s recent spike to $75 has not been the driver of consumer pessimism
I study nuclear science
I love my classes
I got a crazy teacher
He wears dark glasses
Things are going great, and they’re only getting better
I’m doing alright, getting good grades
The future’s so bright, I gotta wear shades
I gotta wear shades
“The Future’s So Bright, I Gotta Wear Shades” was the only mainstream hit by folk rock band Timbuk 3 and opened their debut album, Greetings from Timbuk3. Released in 1986, it climbed as high as #19 on Billboard’s Hot 100 chart. Band founder Pat MacDonald revealed on VH1’s 100 Greatest One-Hit Wonders of the 80s that the meaning of the song was widely misinterpreted as a positive perspective about the near future. On the contrary, it was a grim outlook. While not saying so directly, MacDonald hinted at the idea that the bright future was in fact due to an impending nuclear holocaust. It was a song, born during the last years of the cold war, among a smattering of predictions transcending several cultures which had foreshadowed the world ending in the 1980s.
Since you’re reading this, you’re aware those prophecies never came to pass. At last check, it is 2021. As for a bright future, it’s on display in our future inventories proxy. This forward guide for “it-girl” metric ISM manufacturing New Orders is a composite of manufacturing, services and retail future inventories indices from business surveys reported by the Federal Reserve Banks of Dallas, Kansas City, New York, Philadelphia and Richmond. Recall, the rule of thumb: “If you want to build future supply, order more today.”
How bright was September’s reading? The 14.2 figure was nearly 10 times greater than the last decade’s average of 1.4. The seven-month double digit streak culminating in September is unmatched over any span in the last 20 years. Moreover, after applying our favorite normalizer, every month in the period from March to September exceeded a 2 z-score (deviation from the mean adjusted for volatility, yellow line).
Full disclosure: We’ve used the future inventories proxy consistently as a near-term gauge for cyclical momentum in the U.S. economy. The past relationship between it and ISM New Orders provided confidence to make high conviction calls about future fundamentals. The divergence in the last seven months implies a breakdown in the connection between the two figures. A simple one-factor regression predicted ISM readings in the 70s; actual numbers were in the 60s (and z-scores were in the 1s, blue line).
A look back over history in the right chart shows that future inventories is the ‘yin’ to ISM orders ‘yang’. But not in 2021. The decoupling can be explained by the supply chain’s inability to meet demand. The persistence of future supply outperformance over current new orders means not all orders are being fulfilled. We wouldn’t go so far to call this a grim outlook like Timbuk3’s MacDonald. Instead, it’s the oxymoronic, “disappointing right-tail” problem that manifests in higher cost inflation across production and distribution channels.
Another leading indicator that’s become disconnected from the past ebb and flow of the two cyclical guides is illustrated in yellow and blue above. Since 2019, consumer expectations (red line) became unglued from the past path that tracked relatively closely to future inventories and ISM orders. Two years ago, the former was bolstered by income expectations driven by a late-cycle money grab via good unemployment (i.e., job leavers/quits), while the latter two were faced with buffeted by the trade war.
As multiple contemporary gauges corroborate, current household optimism for an economic recovery has faded. The all-clear surge in consumer expectations pushed the index to 111.9 in March, a full recovery from February 2020’s pre-pandemic level of 108.1. This month’s 86.6 print rivals the depths of the COVID recession; its z-score registered an incontrovertible 0.0. Consumers must have grown accustomed to the consistency of the stimulus checks being direct-deposited every few months.
The Conference Board noted that the “declines suggest consumers have grown more cautious and are likely to curtail spending going forward.” Households have flagged a full-on retreat in spending intentions for autos, homes and major appliances. In fact, six-month forward plans to buy a new vehicle and/or home both neared record lows in September. Sticker shock has clearly set in signaling a buyers’ strike.
The Conference Board’s tally of inflation expectations also scores points for Team Persistent. Since the calendar turned in January, 12-month forward inflation expectations have printed north of 6% in every month building in higher lows and higher highs. Translating to z-scores, the latest are running in the +2 neighborhood (purple line).
Over time, Conference Board inflation expectations and oil prices have closely co-trended. Dare we venture yet another ‘however,’ the recent run-up in West Texas Intermediate to the $75 zone translates to just a 0.5 on the z-score scale (orange line). This implication: consumers aren’t complaining about oil in the context of their collective forward view on prices. Something else is amiss.
This is where we should add that consumers perceive their future as none too bright when it comes to the key spending gauge of income expectations that’s retreated for three months running. Rising pessimism for future employment conditions, which are nearly 16 points south of their June apex, (“Fewer Jobs”) and a bottoming in the unemployment proxy “Jobs Hard to Get” also cast a late cycle glare that doesn’t require shades to shield. Double dip, anyone?