
WQIB DENNIS MCGILL
Monthly Archives: October 2021
Cyclicals Leave No Gray Area
QI TAKEAWAY — We re-reiterate our call that Consumer Staples are poised to outperform in an environment in which it’s irrefutable that the majority of Americans have run dry of funds to splurge on inflation-juiced discretionary goods.
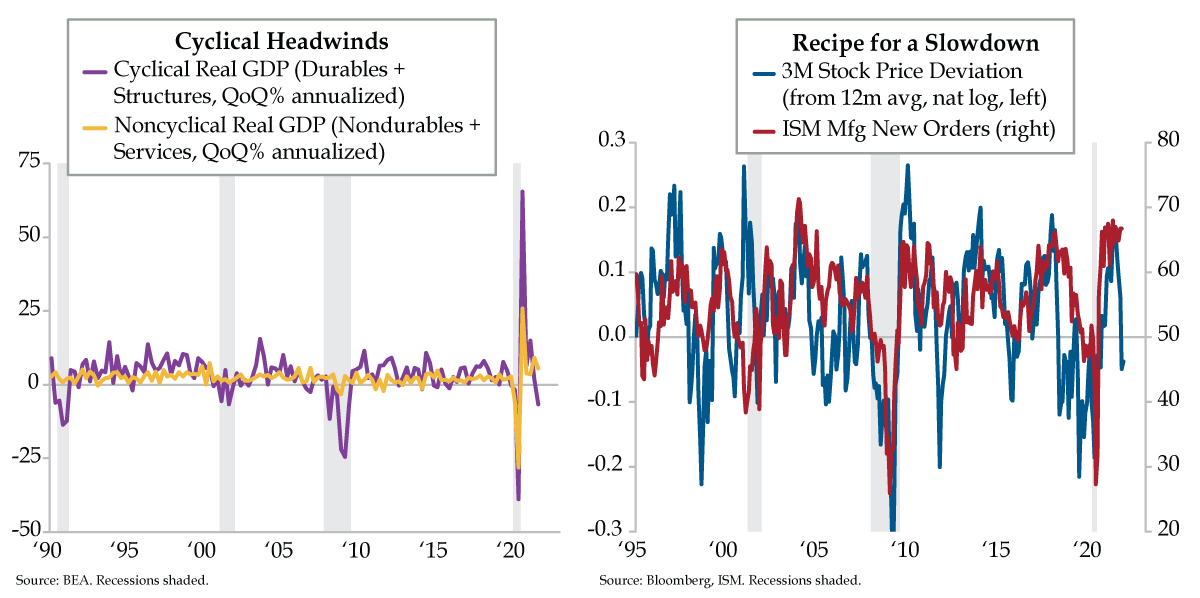
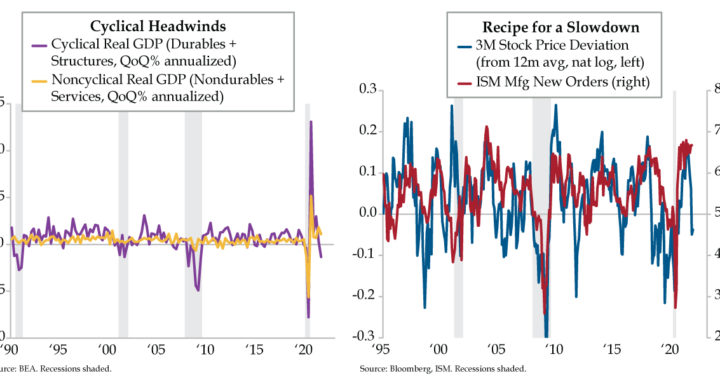
- Driven by services, consumption added 1.09 percentage points to Q3 headline GDP; goods spending, which shaved 2.3 ppts off GDP contribution to real spending, was flattered by services and non-durables, which slumped to a 5.4% QoQ pace from Q3 2020’s +25.9% print
- Inflation-adjusted growth in durables and construction spend fell to a -6.8% QoQ pace in Q3, down from 2020’s 65.4% record; meanwhile, per BofA, with a 19% 2-yr growth rate that’s 6 ppts above the summer average, services spending remains driven by higher income earners
- 3M’s stock price remains a cyclical stalwart, deviating from its 12-month trend in recent years only during the Euro crisis, the mid-2010s industrials recession, and today; the stocks’ correlation with ISM New Orders suggests an unexpected downside from the latter indicator
Asa & Ed’s Failed Peach State Raceway

VIPs
- Driven by services, consumption added 1.09 percentage points to Q3 headline GDP; goods spending, which shaved 2.3 ppts off GDP contribution to real spending, was flattered by services and non-durables, which slumped to a 5.4% QoQ pace from Q3 2020’s +25.9% print
- Inflation-adjusted growth in durables and construction spend fell to a -6.8% QoQ pace in Q3, down from 2020’s 65.4% record; meanwhile, per BofA, with a 19% 2-yr growth rate that’s 6 ppts above the summer average, services spending remains driven by higher income earners
- 3M’s stock price remains a cyclical stalwart, deviating from its 12-month trend in recent years only during the Euro crisis, the mid-2010s industrials recession, and today; the stocks’ correlation with ISM New Orders suggests an unexpected downside from the latter indicator
Asa Candler, Jr. felt the need for speed. In early 1909, the son of Coca-Cola founder and future Atlanta mayor Asa Griggs Candler had a vision to satisfy that need. Driven to compete with the recently announced raceway in Indianapolis, Candler set out to build a racetrack that would put car racing squarely in the heart of the Peach State. Candler and business partner Ed Durant quietly bought up properties along Virginia Avenue south of Atlanta. If you fancy yourself an archivist, you can find the original blueprint showing parcels of land purchased from Hapeville residents in the Candler papers at the Rose Library Rare Papers Archive at Emory University. It took 1,000 mostly unpaid prison workers all of five months to build the two-mile raceway. Alas, interest in racing didn’t even make it past a second season. Asa Candler, Sr. cut his losses and closed the track which subsequently underwent foreclosure. The savvy businessman reacquired the abandoned half-million property for $1,000 in 1914. Five years later, the property was donated for the purpose of an ‘aero landing place.”
Today, Hartsfield–Jackson Atlanta International Airport is the nation’s busiest by passenger traffic with about 104 million traveling through it, about 20 million more than for the second busiest airport in the US. For 19 straight years, Hartsfield has also been deemed the most efficient U.S. airport. This evening, QI will fly into Atlanta, doing our fair share to sustain the services spending that helped improve air passenger traffic to -20.2% in the week ended October 25th vs. the same week in 2019, a 1.2% improvement over the prior week. Clearly, our endeavoring to travel feeds the trend that lifted services spending by the 7.9% annualized pace in the third quarter GDP report that electrified markets Thursday morning. Overall, consumption added 1.09 percentage points (ppts) to headline GDP, with services adding 3.4 ppts, a tidy offset to goods contracting by 2.3 ppts.
For all of the hullabaloo, services spending declined in the three months ended September from a pace of 11.5% in the second quarter. The swing for goods was appreciably more pronounced – from +13% to -9.2% in the third quarter. As you see in the yellow line on today’s left chart, when you combine the contribution to economic output of inflation-adjusted spending on services and nondurables, the pace has slumped to a 5.4% quarter-over-quarter (QoQ) pace from 25.9% in 2020’s third quarter. As dramatic a pendulum swing as this is, services and nondurables don’t serve the role of leading indicators.
Monday’s release of September’s Chicago Fed National Activity Index (CFNAI) presaged the violence depicted in the purple line, which does lead the broader economy. When broken down into baskets, the only positive contributors were Employment & Hours and Sales, Orders & Inventories. These were more than counterbalanced by the negative drag of Production & Income. Say what you will about the relatively scant contribution of the non-services U.S. economy. Consider us old fuddy-duddy’s as long as cyclicals continue to successfully flag inflection points in the economic cycle, which brings us back to that purple line. In 2020’s third quarter, the sum of inflation adjusted QoQ growth in durables and structures (residential & nonresidential construction) was a postwar record 65.4%; one year on, it’s back in the red, at a -6.8% pace, the sickliest since the pandemic quarter that ended in March 2020.
We’ve been forewarned by the slowdown in China’s cyclical sector which, like it or not, is still the global marginal industrial signpost. And as our friends at the China Beige Book (CBB) astutely point out, China may be in clampdown mode beyond February’s Paralympics closing ceremonies. As CBB tweeted out yesterday, “We’ve cautioned about getting head-faked by a relaxation of policy crackdowns in the run-up to the 6th Plenum or Olympics. This ‘campaign’ is not about the Olympics nor Big Tech. The bigger picture doesn’t change until post-fall 2022 Party Congress, at the earliest.” That’s a year from now, folks, just as Americans head to the polls for what promise to be bloody Midterm elections.
For those of us paying attention, the good news is real-time indicators have long since broadcast the headlines to come. It’s called the price of 3M’s stock (blue line). Study the recent dips below trend. Aside from recessions and the initial shock of the pandemic, the stock price of this cyclical stalwart has deviated negatively from its 12-month trend three times in recent years – during the Euro crisis, the 2015/2016 industrials recession…and today. You don’t have to be a rocket scientist to know what’s to come for the red line, the one indicator that freaks out stock jocks almost as much as that initial nonfarm payroll print – ISM New Orders.
It’s an inconvenient truth that services spending continues to rise. Why the dour characterization? According to Bank of America, the catch is the sole driver is the wealthy: “The gain in spending amongst the higher income cohort continues, running at a 19% 2-year growth rate, which is 6 ppts above the summer average. This is a decisive turn higher that is not evident in the lower income cohort. We think this differential largely owes to the reengagement of leisure service spending which, on balance, is a higher share of higher income consumer baskets.” It’s almost as if we were looking at the U.S. economy through a microcosm of a circa 1910 failed racetrack.
Canadian Cross Currents
QI TAKEAWAY — The BoC launched a shock ending to QE. Short-term Canadian government bond yields reacted with a violent repricing. While persistent inflation risk was behind the BoC’s pivot, a disappointing U.S. GDP report could create a slowdown narrative which generates calls that the sell-off in Canadian government bonds could be overdone.
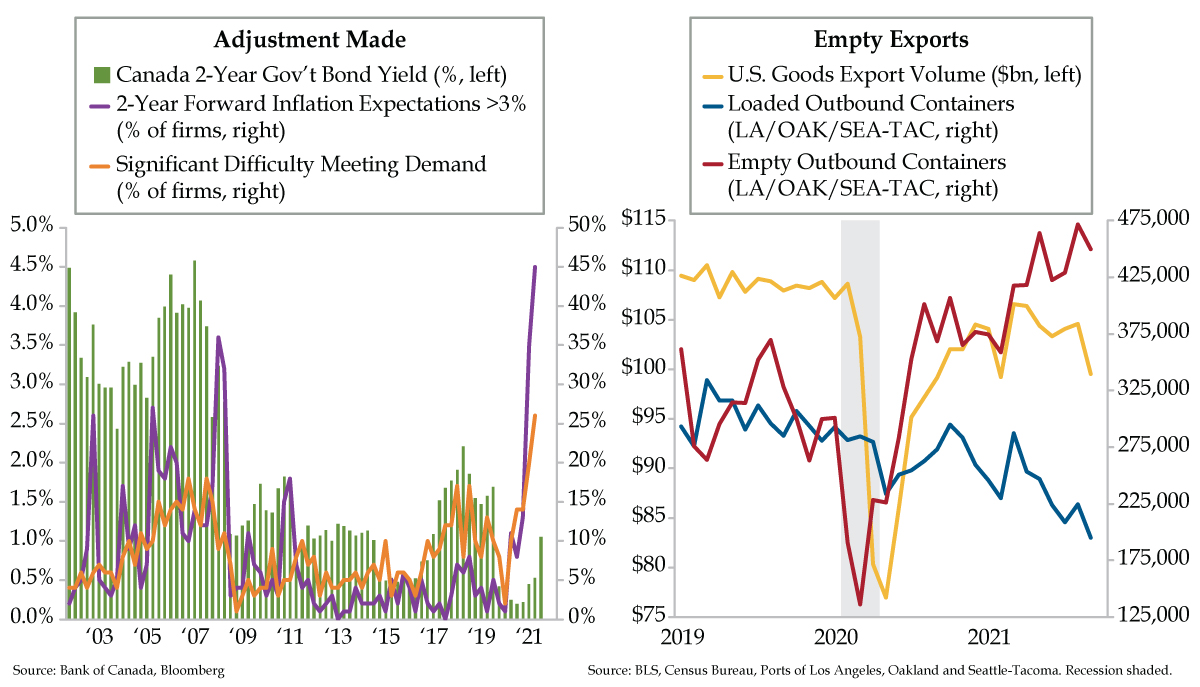
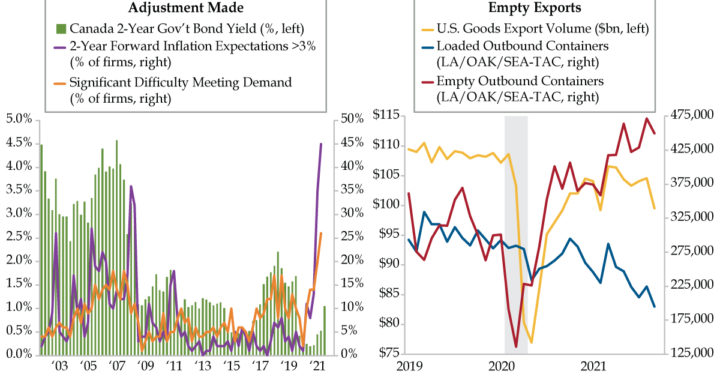
- The Bank of Canada ended its QE program yesterday, causing a 26 bap jump in the two-year yield in the first twenty minutes after the announcement; after ending Q3 near 50 bps, two-year yields broke the 1% barrier as the BoC let the rate volatility genie escape from the bottle
- In the BoC’s Q3 Business Outlook Survey, 26% of firms cited difficulties meeting demand, a record high, on account of supply chain issues and a shortage of labor; meanwhile, roughly half of Canadian businesses expect inflation to be at least 3% over the next two years
- IHS Markit predicts Q3 U.S. GDP growth of 1.6% vs. the 2.6% consensus, with inventories driving the entire gain; trade data feeds this development, with goods exports falling by 5% MoM in September and more empty containers leaving West Coast ports than full ones
Canada Gets an Adjustment
VIPs
- The Bank of Canada ended its QE program yesterday, causing a 26 bap jump in the two-year yield in the first twenty minutes after the announcement; after ending Q3 near 50 bps, two-year yields broke the 1% barrier as the BoC let the rate volatility genie escape from the bottle
- In the BoC’s Q3 Business Outlook Survey, 26% of firms cited difficulties meeting demand, a record high, on account of supply chain issues and a shortage of labor; meanwhile, roughly half of Canadian businesses expect inflation to be at least 3% over the next two years
- IHS Markit predicts Q3 U.S. GDP growth of 1.6% vs. the 2.6% consensus, with inventories driving the entire gain; trade data feeds this development, with goods exports falling by 5% MoM in September and more empty containers leaving West Coast ports than full ones
Chiropractic medicine began in 1895 when Daniel David Palmer of Iowa, a teacher and grocer turned magnetic healer, performed the first chiropractic adjustment. Palmer believed that adjusting the spine was the cure for all diseases for the human race. His first patient was a partially deaf janitor named Harvey Lillard. While Lillard was working with his shirt off in Palmer’s office, Lillard bent over to empty the trash can. Palmer noticed that Lillard had a vertebra out of position. He asked Lillard what happened, and Lillard replied, “I moved the wrong way, and I heard a ‘pop’ in my back, and that’s when I lost my hearing.” Palmer, who was also involved in many other natural healing philosophies, had Lillard lie face down on the floor and proceeded with the adjustment. The next day, Lillard told Palmer, “I can hear that racket on the streets.” Two years later, Palmer opened a chiropractic school.
Spinal adjustments have been going on ever since. Metaphorically speaking, the Canadian government bond market surprised the world with an unexpected visit to the chiropractor yesterday. The doctor’s address is 234 Wellington Street, Ottawa, Ontario. If you can’t place the location, it’s where Tiff Macklem moonlights as a chiropractor from his day job as Governor of the Bank of Canada (BoC).
In a shock move Wednesday morning, the BoC ended its quantitative easing (QE) program and shifted to reinvestment mode to maintain its balance sheet assets. This hawkish act generated a 26-basis point intraday increase in the Canadian two-year yield in the first twenty minutes after the 10:00 a.m. announcement. The last time there was an uptick in two-year yields of this magnitude was October 2009 when the Canadian economy was emerging from the Great Recession. Two-year yields ended the third quarter around 50 basis points (green bars) and broke through 1.00% in yesterday’s trading session. The BoC let the rate volatility genie escape from her bottle.
Tiff, why the adjustment? BoC projects the output gap will close sooner than anticipated. In July, it called for economic slack to be absorbed in the second half of 2022. This forecast was moved forward to anticipate closure in the middle quarters of next year. As an inflation targeting central bank, the statement also was central to the hawkish pivot (bolding ours): “The recent increase in CPI inflation was anticipated in July, but the main forces pushing up prices – higher energy prices and pandemic-related supply bottlenecks – now appear to be stronger and more persistent than expected.”
Three months ago, we published the left chart. Today seems an appropriate time for an update. For the output gap discussion, there’s persistence in firms facing significant difficulty meeting an unexpected increase in demand, so much so it rose to 26% in the third quarter, a fresh high (orange line). The BoC third-quarter Business Outlook Survey (BOS) noted that this was broad based across sectors and regions with the exception of the Prairies. BoC also explained that two important supply issues — supply chain disruptions and labor shortages — were driving the capacity constraints.
For the inflation debate, shift your focus to the purple line. According to the BOS, almost half of Canadian businesses now expect inflation to be above 3% over the next two years, with most anticipating it will be between 3% and 4%. Firms with inflation expectations above 3% frequently cited supply chain disruptions, fiscal and monetary policy stimulus and recent increases in food and energy prices supporting their elevated – and above target – expectations.
Timing of the BoC move came one day before the U.S. reports its first look at third-quarter gross domestic product (GDP). Going into today’s release, the experts at IHS Markit, who earn their keep making accurate, real-time GDP estimates, anticipated growth of 1.6%, a full percentage point disappointment versus the 2.6% consensus.
The headline number is not where the real story lies. The key aspect of today’s GDP will be the composition between demand and supply, something we flagged three weeks back. Per IHS’s math, there’s a decent chance that final sales (GDP less inventories) now CONTRACTS in the summer quarter and that inventories account for more than the entire GDP gain.
Yesterday’s advance international trade data fed this development. As seen in the right chart, the volume of goods exports appears to have declined by nearly 5% month-over-month in September, dragging the full quarter down by an annualized 7% sequential rate. We include two other series from three Pacific Coast ports to illustrate a point. More empty containers are being exported from Los Angeles, Oakland and Seattle-Tacoma (red line; Long Beach not included because it doesn’t break out outbound empties) than those that are fully loaded (blue line). Until it’s less profitable to ship empties to China, this technical factor is likely to act as an impediment to U.S. export growth.
Whether fundamental or technical, there’s a Pavlovian Street response to unfavorable mixes for near-term growth prospects. As the lightning flattening of the yield curve broadcasted, a chiropractic downward adjustment to fourth-quarter U.S. GDP by the entire forecasting community is in the offing. For the short-run Canadian dollar outlook, slowdown risk from the U.S. would be a bearish offset to the BoC’s unexpected pivot which is advertised as a bullish development. Because of these cross currents, we wouldn’t be surprised if sell-side rates strategists started chirping “overdone” for the sell-off in government of Canadian bonds.
Discretionary Consumption Challenged Despite Buoyant Leisure Travel
QI TAKEAWAY — Bearish signals on the stock market, cooling income expectations and auto and home buying uncertainty outweigh positive travel trends. For those with portfolio holdings in RV companies, such as high-flyers Thor and Winnebago, that have seen double-digit annual stock price gains, cashing in some chips might be a prudent course of action.
- October’s Conference Board consumer survey found 36.0% of consumers polled seeing stock declines in the future vs. 33.3% seeing stocks rising; though conviction is low, the -2.7% spread between increase and decrease was the first bearish signal since July 2020’s -1.8%
- Income expectations, which have a 0.61 correlation with stock price expectations since 1987, have also cooled slightly; meanwhile, household buying plan uncertainty for autos and homes rose above normal levels in October, on account of higher prices tempering purchases
- 47.6% of consumers signaled they intend to take a vacation within six months, the highest since February 2020’s 54.9%; Smith Travel Research data shows that intentions have been realized, with hotel occupancy growing at double-digit YoY rates for 31 weeks since March
Bear Sightings
VIPs
- October’s Conference Board consumer survey found 36.0% of consumers polled seeing stock declines in the future vs. 33.3% seeing stocks rising; though conviction is low, the -2.7% spread between increase and decrease was the first bearish signal since July 2020’s -1.8%
- Income expectations, which have a 0.61 correlation with stock price expectations since 1987, have also cooled slightly; meanwhile, household buying plan uncertainty for autos and homes rose above normal levels in October, on account of higher prices tempering purchases
- 47.6% of consumers signaled they intend to take a vacation within six months, the highest since February 2020’s 54.9%; Smith Travel Research data shows that intentions have been realized, with hotel occupancy growing at double-digit YoY rates for 31 weeks since March
One can’t further separate the rarified air of Augusta National’s azalea-accessorized greens and Pebble Beach’s ocean views from Hillbilly Golf. Located in Gatlinburg, Tennessee near the Great Smoky Mountains National Park, this half century old establishment qualifiers as the world’s most unusual miniature golf course. You ride an incline railway up the side of a mountain and disembark to choose one of two 18-hole challenges to play downhill. “Dueling Banjos” twang in the background as you play the holes. Expect to pass quaint, countrified obstacles such as outhouses and moonshine stills along the way. One of the most unlikely hazards, a 160+ year old hemlock tree that was on the hill prior to the Civil War, had stood proudly over Hillbilly Golf for 45 years. In 2016, however, it sadly was uprooted during wildfires that hit the area. Thanks to the efforts of Hillbilly Golf’s team, its roots were saved to watch over every player brave enough to grace the (miniature) course.
Dr. Gates frequented this bucket list attraction during his family’s summer vacation. The most interesting sign encountered at the base of the hill before you board the tram reads, “Be Bear Aware: Last Bear Sighting” and the date of the occurrence. Gates did a double take when the date read the same day he was playing, present tense at the time.
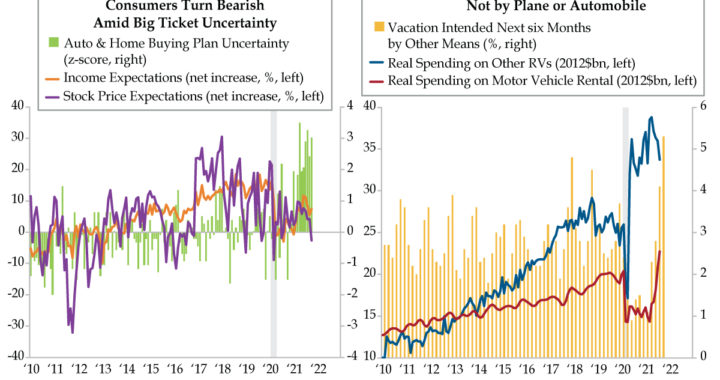
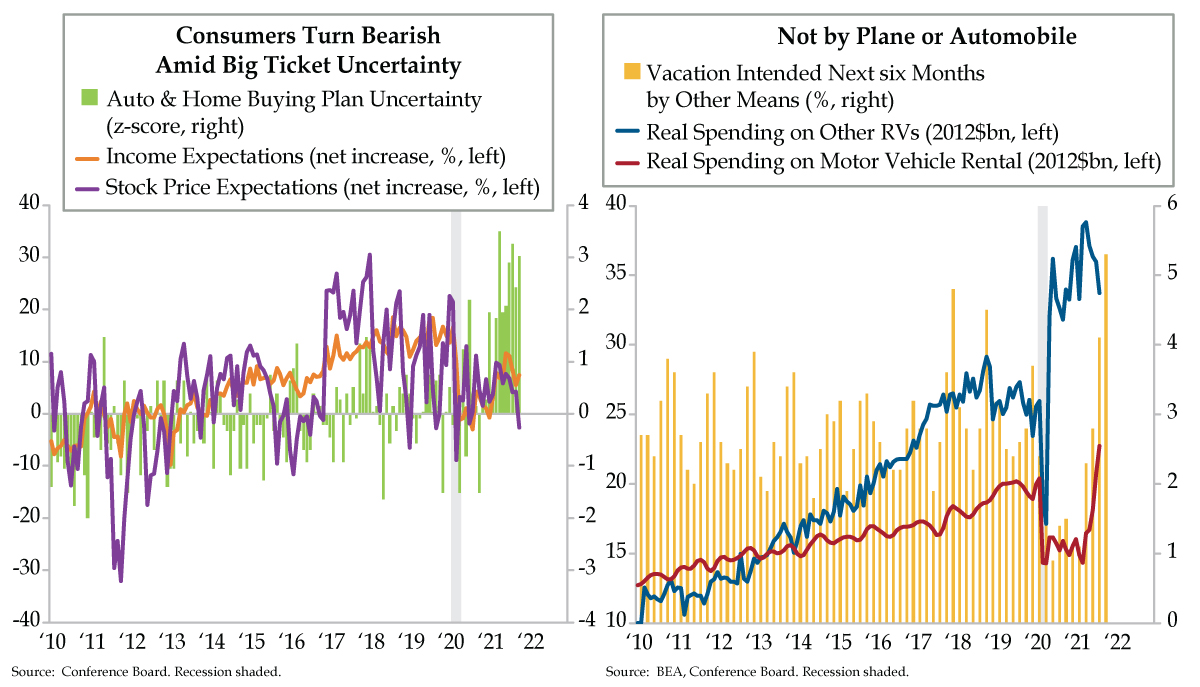
Hillbilly Golf link lovers are joined by U.S. households seeing bear crossings. It might be hard to fathom given the U.S. stock market can’t do anything but proclaim one record high after another. Yesterday’s Conference Board consumer confidence survey did just that. Consumers are queried on their expectations for stock prices in the next 12 months. In October, 36.0% of consumers polled saw stock declines over the horizon vis-à-vis 33.3% calling for rising stocks. Moreover, only 30.7% thought stocks would be unchanged. For what it’s worth, the distribution of answers – all with 30-handles – exuded low conviction. The bear sighting was in the -2.7% spread between increase and decrease (purple line), the first bearish signal from households since July 2020 (-1.8%) and the largest since the Coronavirus first burst onto the scene in March 2020 (-8.9%).
Granted, households aren’t the best predictors. That said, in the four years through 2019, the Conference Board’s stock market expectations spread had a .74 correlation to the S&P 500’s trailing 12-month performance. Since then, however, that co-movement has slid to .22, with the benchmark index far outpacing consumer expectations. For that, we have the power of passive investing to thank juiced as never before by record levels of monetary and fiscal stimulus injections.
Consumer stock market expectations has a higher beta than income expectations (orange line). This holds intuitively given equity volatility comes with the territory of trading shares week in and week out. Meanwhile, paychecks, the basis for income expectations, are generally more stable for hourly workers and, especially, for salaried workers. Despite one making more noise than the other, income expectations has a .61 correlation to stock price expectations since the latter’s inception in 1987.
For asset holders up the income distribution, gains in the stock market are akin to income gains. Managers that get paid in shares reap the benefits when the wind is at the back of their firms’ stock price. When the broader market is rising, it also strokes the psyches of upper-income individuals.
Notably, income expectations has cooled, but not as much as stock price expectations concurrent with households’ uncertainty around buying plans for autos and homes rising to above normal levels. The green bars combine the responses the Conference Board asks directly of consumers; ‘uncertain’ is one of the choices under the auto and home buying plan questions. It’s no secret that higher prices have thwarted big-ticket purchases for homes and sport utility vehicles. The upshot: uncertainty with the capacity to further constrain demand.
From consumers’ perspectives, all is not for naught. The travel recovery continues unchecked: In October, 47.6% of consumers signaled they intended to take a vacation within six months, the highest since the pre-COVID month of February 2020, when 54.9% indicated the same. Per Smith Travel Research, these intentions have been realized. Since March, hotel occupancy has expanded at double-digit year-over-year rates for 31 straight weeks; average daily rates have by grown by more than a 30% annual pace since April.
Delving into the weeds, the Conference Board survey revealed fewer than normal consumers opting to board planes offset by appreciably more Americans taking to the open roads. Most intriguingly was the “other means” of travel, which vaulted to the second highest on record in October (yellow bars) behind the record high of February 1996, the month of that year’s blizzard.
“Other means” probably don’t mean tram cars on incline railways in the heart of the Smoky Mountains. But they can include passenger trains, boats, recreational vehicles (RV) and rentals vehicles. These last two are illustrated by the blue and red lines, respectively, in today’s right chart. Post-pandemic purchases of other RVs surged and will likely be deployed for excursions over the next six months. Vehicle rentals flag a parallel bullish sign. As encouragingly adventurous as these are, bearish signals on the stock market, cooling income expectations and auto and home buying uncertainty will outweigh the positivity of travel in the larger consumer spending mosaic.
Cycle Compression in Germany
QI TAKEAWAY — The disconnect between ex-energy commodities, the dollar and the real global economy is becoming more apparent as signs of a spreading slowdown proliferate. The lack of Fed tools to address stagflation should cap long-maturity rates as policy errors, plural, get priced into risky asset prices.
- Per the ifo Institute, at -4.6 points, German business expectations were decidedly below trend in October after running an above average 13.4 points in June; the 18-point swing in 4 months has historical comparisons only to the pandemic’s onset and Great Financial Crisis
- ifo’s Business Cycle Clock, which tracks German business conditions and expectations, was in the “slowdown” quadrant for a second straight month in October; this is the first year that has seen all four quadrants traversed on account of the pandemic’s cycle hyper-compression
- China’s manufacturing New Orders-Inventories spread has slowed, helping temper German business expectations; a continued slowdown in activity could lead ECB policymakers to turn dovish just as the Fed begins its tapering efforts, piling onto euro bearishness
If I Could Turn Forward Time
VIPs
- Per the ifo Institute, at -4.6 points, German business expectations were decidedly below trend in October after running an above average 13.4 points in June; the 18-point swing in 4 months has historical comparisons only to the pandemic’s onset and Great Financial Crisis
- ifo’s Business Cycle Clock, which tracks German business conditions and expectations, was in the “slowdown” quadrant for a second straight month in October; this is the first year that has seen all four quadrants traversed on account of the pandemic’s cycle hyper-compression
- China’s manufacturing New Orders-Inventories spread has slowed, helping temper German business expectations; a continued slowdown in activity could lead ECB policymakers to turn dovish just as the Fed begins its tapering efforts, piling onto euro bearishness
Some songs will forever be more recognizable on the silent screen. Cher’s 1989 MTV mega-hit “If I Could Turn Back Time” fits that bill. The video was filmed on board the U.S.S. Missouri while it was stationed at Pier D in the former Long Beach Naval Shipyard for routine maintenance. In a December 2013 interview with Q magazine, Cher recalled of the multiple days of filming: “There was a whole story – I climbed up stuff, I was running away from a lover. I was in a cage, in a speedboat…And when the director got to the edit, he just said, ‘F this, here’s the money (shot)’ – me on the battleship with the sailors. They were real sailors too. They were funny. They kept calling me ma’am.” It was Cher’s outfit – fishnet body stocking under a black one-piece bathing suit exposing her butterfly tattoo – that proved most controversial to television networks, to say nothing of the Navy, which expected Cher to wear a jumpsuit instead. MTV initially banned the video…
It may have felt as if time was turned back when the pandemic first hit when comparisons to the 1918 Spanish Flu were prolific. More than a year after COVID-19 involuntarily locked down the world, we reflect on the flash recession that was the shortest and deepest ever recorded. The thing is, the pandemic didn’t just turn back time, it also propelled it forward. Add one part “shock of a temporary nature” to “unprecedented policy response of 42.3% of GDP inside 18 months” and you arrive at the cycle compression narrative. The U.S. economy, for instance, has moved much more quickly to a mid-cycle phase according to a majority of fund managers. Other economies might even be further along in the sped-up process.
As flagged yesterday, Germany is case in point. Its most important business survey indicated that the German economy has clouded over. The market-moving report for October was titled, “Supply Problems Weigh on ifo Business Climate.” And the ifo Institute had some straightforward observations: “Skepticism is increasingly evident in expectations. Companies’ assessments of their current situation are also less positive. Supply problems are giving businesses headaches. Capacity utilization in manufacturing is falling. Sand in the wheels of the Germany economy is hampering recovery.”
Surprise, surprise — supply bottlenecks were singled out for the underperformance in the manufacturing and trade sectors. But the deterioration in business expectations was also evident in the service sector too. In a world of artificially suppressed interest rates, the construction sector saw the only sector which saw more optimism on tap.
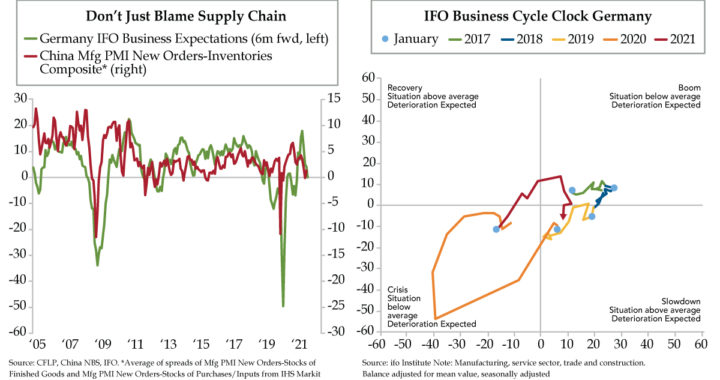
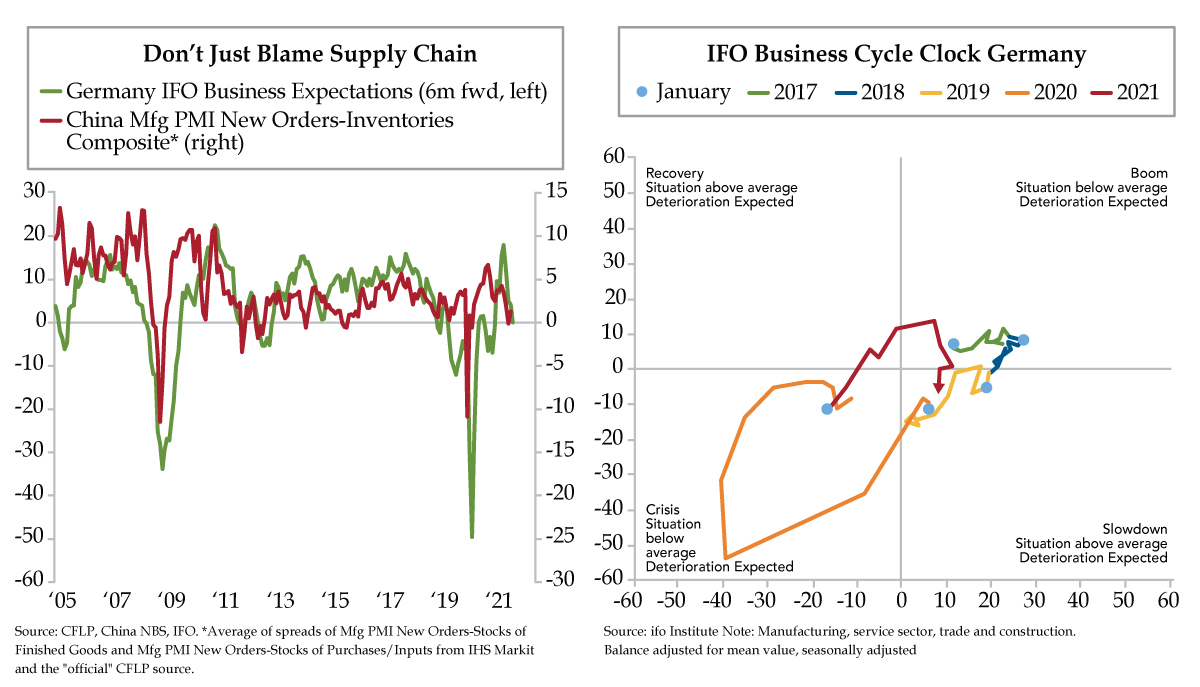
The most interesting graphic in the report was the ifo Business Cycle Clock, depicted as our left chart. For those not familiar with the concept, the clock shows the cyclical relationship between the current business situation and business expectations in a four-quadrant diagram. The scatter plot of economic activity passes through quadrants labeled with the different phases of activity – recovery, boom, slowdown, and crisis. If survey participants’ assessments of the current business situation and their business expectations are both below average, economic activity is plotted in the “crisis” quadrant. If the expectations indicator is above average (with an improving but below average business situation), economic activity moves to “recovery.” If the business situation and expectations are both above average, economic activity lands in the “boom” quadrant. If, however, the expectations indicator falls below average (with a deteriorating, but above average, business situation), economic activity slips into the “slowdown” quadrant.
To recap 2021, January and February put Germany’s economy in the crisis quadrant. Over the next three months through May, the economy progressed into the recovery quadrant. In the summer months through August, a boom commenced. Drum roll (not really…), we’ve segued into a slowdown. At -4.6 points, business expectations moved decidedly below trend in October after running at an above average +13.4 points as recently as June. The 18-point pendulum-swing compares only to periods during the Great Recession in 2008 and the flash pandemic recession of 2020. Notably, October marked the second month in the slowdown quadrant.
This signifies the dramatic cycle compression that’s fast manifesting as a global phenomenon. This year is the only in which the ifo Business Cycle Clock raced through all four quadrants, an unprecedent if there ever was one in the 16 years since the series’ 2005 inception. Bear in mind, the ifo business measures cover the whole economy encompassing manufacturing, trade, services and construction.
As we’ve emphasized in tandem with slowing (Tesla’s blowout sales day excluded) U.S. car sales, the demand slowdown is more than a supply chain story. Part of the disappointment in German business expectations is fundamental, tied to China’s driving Germany’s industrial sector. The slower signal from China’s manufacturing new orders-inventories composite indicator (red line) tells us all we need to know about the turnabout in Germany’s business expectations (green line).
German executives probably wish they could turn back time. Alas, the cycle has instead been hyper-driven into a slowdown. A further stay in the bottom right quadrant could lead European Central Bank monetary policymakers to squawk dovish at a time when the Fed is readying its taper terror. The foreign exchange outlook for the U.S. dollar was bullish before stemming from the difference in central bank policy guidance. A German slowdown with legs would pile on euro bearishness and heighten conviction in a dollar bull call.