VIPs
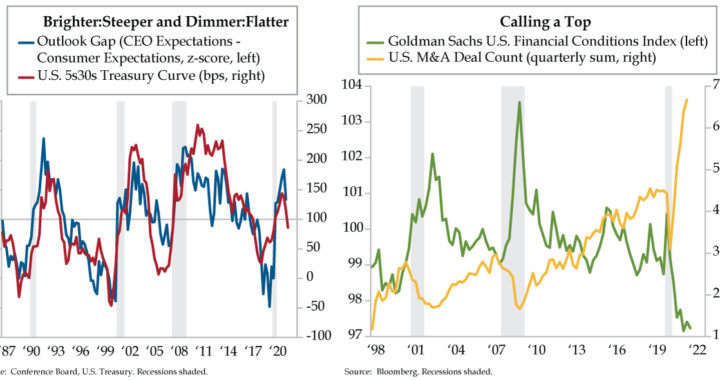
- The spread between the 5-year note and 30-year bond fell below 100 basis points over the last week, hitting 85 bps in yesterday’s trading session; after the 1990, 2001, and 2007-09 recessions, the 100 bps level served as a demarcation line from early to middle/late cycle
- As firms battle wage pressures via M&A activity, U.S. deal counts have reached successive records in Q2 and Q3; the October-to-date deal count is tracking to 2,200 by the end of the month, which would be the fourth highest on record behind September, June, and August
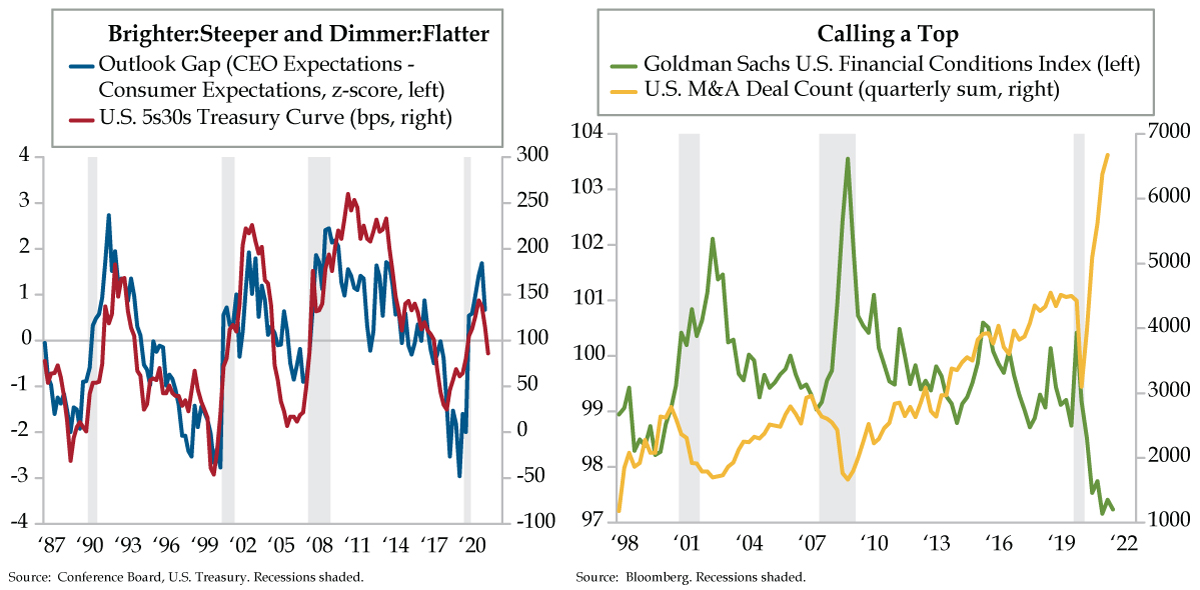
- As a z-score, the Outlook Gap, or spread between CEO and Consumer Expectations, looks to be coming down as it usually does when expansions mature; however, rising wage pressures remain an opposing headwind that is making consumers relatively more optimistic
Joel Spira was aiming for mood lighting. He created an industry. It was the late 1950s, and not only were Americans buying tons of new homes, they were hosting dinner parties with mood music. To Spria’s thinking, the right lighting would further enhance the ambience. Objective identified, he commandeered his apartment’s spare bedroom and set out to complete the moody mission. At that time, lighting control was a complicated and expensive affair, requiring bulky rheostats that used a lot of energy and generated a great deal of heat. Spira’s 1959 emergence from his lab with a solid-state dimmer that could replace the light switch in a standard residential switch box radicalized the lighting scene. His company Lutron was the first to mass-market the dimmer and has never wavered on its undertaking to innovate within the space — the firm’s product lineup has expanded from two products to more than 15,000.
Business cycles work on mood lighting too. Growth momentum burns the brightest coming out of recession and cools as the cycle matures from early to middle to late phases. The forward view from the C-suite also is sunniest early on as productivity and cost saving initiatives drive the outlook for corporate earnings. Not every cycle follows the same script — some, as in the current one, are hyper-compressed, which is evident in the yield curve.
Yield curves steepen at recovery’s outset and flatten as when the expansion begins to exhaust itself. For completeness, the end of cycle signal surfaces when curves invert. To be sure, we’re not there yet. That said, the spread between the 5-year note and 30-year bond fell below the 100-basis point (bp) mark over the last week in decisive fashion. The 5s30s curve tested the 100-bp threshold on September 22 and 23, snap-steepened back to the 112 bps on October 5, and then compressed sharply to near 85 bps in yesterday’s trading session.
For what it’s worth, there’s something about the 100-bp level that marks it as a milestone in cycles. After the 1990 recession, when 5s30s went sub-100, it moved the expansion from early to middle/late. After the 2001 recession, 100 was a demarcation line between early and late. After the 2007-09 Great Recession, 100 divided early/middle with late. It’s not definitive if we are mid-cycle or late cycle, but it’s pretty clear that we are no longer in the Kansas of the early phase.
That brings us to a refresh of a concept we can observe but once a quarter, the Outlook Gap, which compares the spread between the expectations of CEOs and consumers. It peaks early in economic recoveries and grinds down as expansions mature before bottoming into the next recession, echoing the yield curve’s path. We depict the Gap in today’s left chart using our favorite normalizer — the z-score, or deviation from the mean adjusted for volatility (blue line).
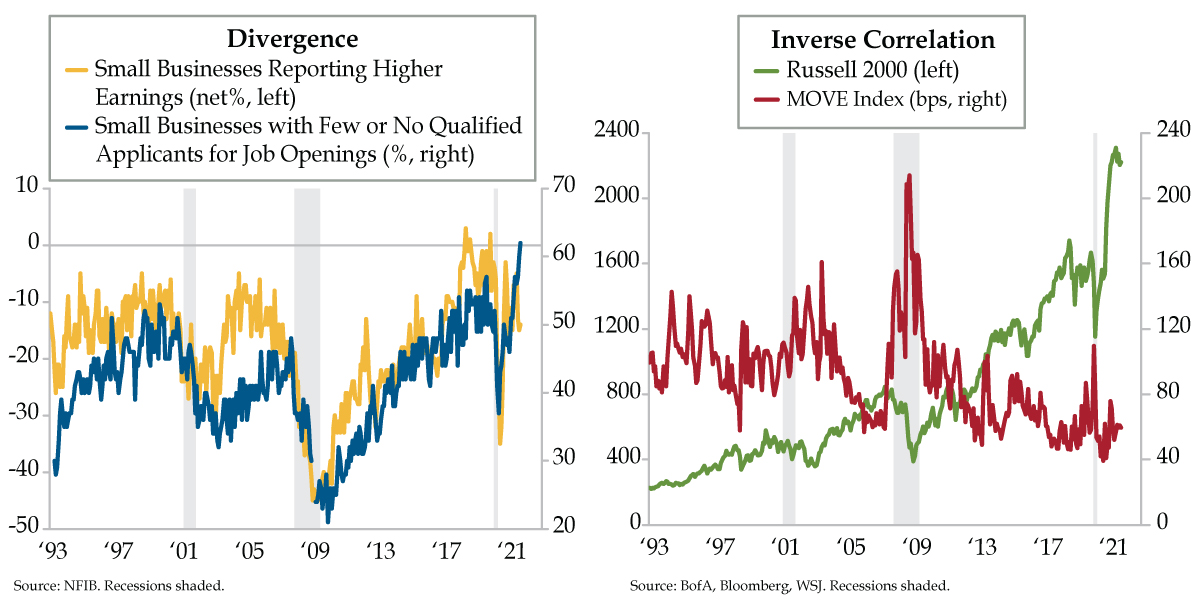
The compression of the current cycle driven by the temporary nature of the pandemic suggests the duration of the yield curve flattening and Outlook Gap narrowing might be shorter than in the past too. At a minimum, the fourth quarter-to-date 5s30s curve is flagging mid-cycle. We would anticipate a similar construct for the Outlook Gap once the autumn quarter figures print. One factor that’s made consumers relatively more optimistic than company heads is rising wages.* Whether it’s small, medium or large companies, anecdotal evidence from business surveys corroborate the trend.
*The one caveat we’d place on that last note, with a hat tip to QI Canadian friend David Rosenberg, is that the latest University of Michigan print showed households’ assessments of the job market at an 8-month low. We won’t know the long term damage exacted by post-pandemic automation acceleration for some time.
Many firms are battling wage pressures via the merger and acquisition (M&A) channel. U.S. deal counts have vaulted to successive records in the second and third quarters (yellow line) as the most accommodative financial conditions on record underpinned this dynamic. The Goldman Sachs U.S. Financial Conditions Index remains ridiculously easy (green line).
As of this writing, the October-to-date deal count is tracking north of 2,200 for the full month. This would land it as the fourth highest on record behind September, June and August of this year. If financial conditions start tightening in a more persistent fashion, conviction would rise for calling a top in M&A, signs which are emerging.
Yesterday, Bloomberg ran a story titled, “Short-Dated U.S. Rate Volatility Spike Follows Fed Pricing Shift.” The U.S. dollar swaption volatility surface revealed that short-dated volatility on front-end rates indicated a hawkish re-pricing of Fed rate hike expectations. Over the last week, the short end of the swaption curve moved from pricing one hike by the end of next year to two, with about half a hike priced into the June 2022 Fed meeting. In addition, 6-month volatility on 2-year rates hit the 60-bp mark, the highest since March 2020.
Rotating the dimmer switch, the compression in the yield curve is pointing to a further fading of the Outlook Gap. A turn in financial conditions would reinforce the shifting mood and signal a top in M&A activity. We would add that Bloomberg one-year forward U.S. recession probability moved off its maximum bullish setting of 10% to 15% in October. All told, these factors imply a less friendly investment environment for risk assets in coming months.