VIPs
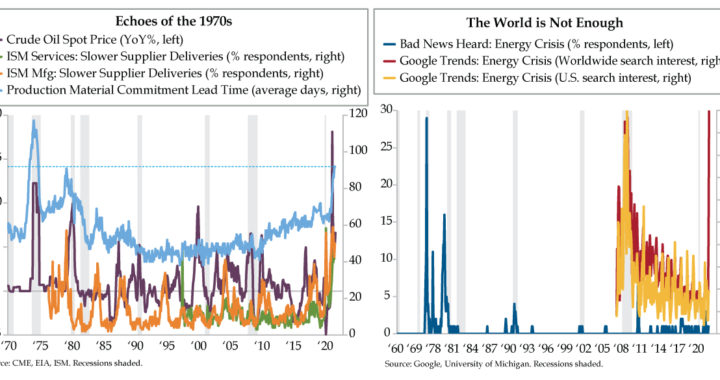
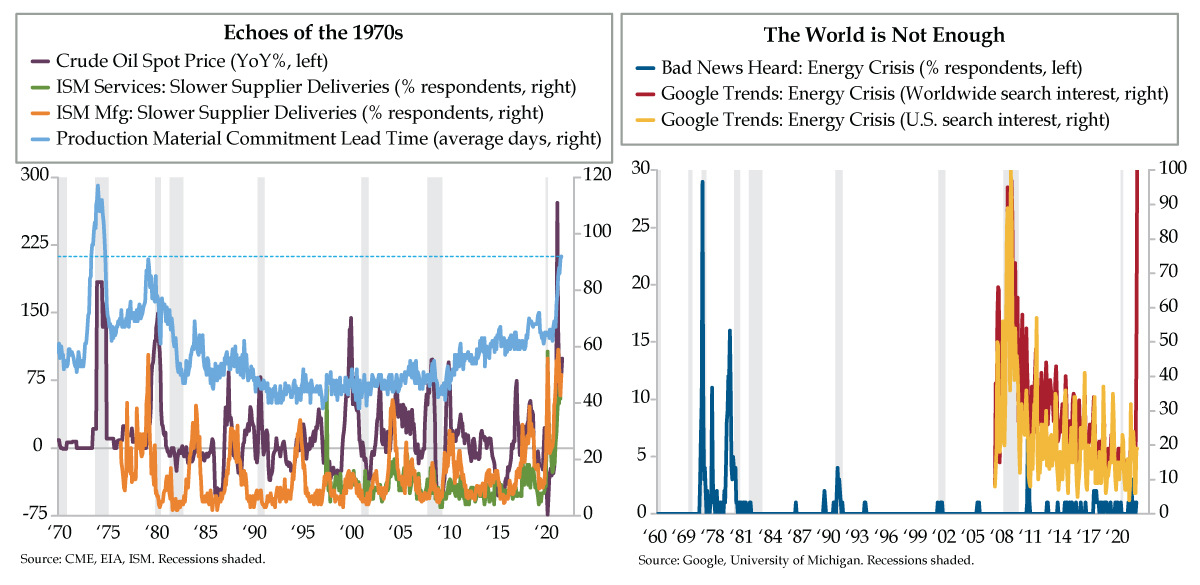
- Per ISM, September’s 92-day average lead time for production materials was the highest since October 1974; deliveries also slowed after three months of progress, with more than 50% of respondents reporting slower deliveries for just the seventh time since the mid-1970s
- Crude oil spot prices have seen YoY gains of more than 60% for the last eight months, echoing the run-up to the 2008 financial crisis; should persistence extend to nine months, the comparison to 1974, which saw 12 months north of 60% YoY gains, will be more relevant
- Bad News Heard: Energy Crisis has barely registered in recent years of UMich’s Survey of Consumers; while Google searches for “energy crisis” in the U.S. were at a 19 out of 100 in October, worldwide interest hit 100, a sign that an energy crisis is underpriced here at home
What do you get when you throw together an airport restaurant cook in an Amsterdam police traffic warden? In the world of pop rock jams, a legend. “Get Ready for This” from the Dutch techno, dance-pop duo 2 Unlimited. Rapper Ray Slijngaard and vocalist Anita Doth didn’t know what hit them in the aftermath of the song’s September 1991 release. Sports fans worldwide react as Pavlov predicted the well-trained would when they hear this call to get on their feet to pump up their teams. “Get Ready for This” peaked in the Top 10 in Australia, Belgium, Canada, Ireland, the Netherlands, Spain, the U.K. and Zimbabwe. The success of the single paved the way for the 1992 album Get Ready to sell three million copies worldwide. The movie and television business also grabbed this intellectual property for such big screen flicks as Space Jam, Flubber and How to Eat Fried Worms and for such small screen shows as Friends, The Big Bang Theory and Brooklyn Nine-Nine.
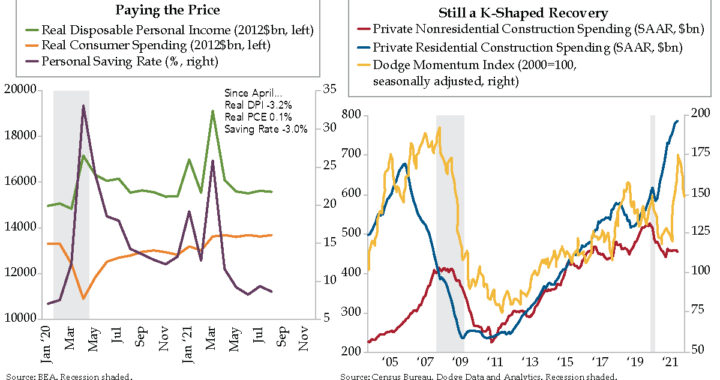
“Y’all ready for this?” This iconic hook applies to today’s economy. Are we reliving the 1970s? Today’s left chart factors lag into the inflation equation using upstream lead time. Over history, when it’s taken longer to source inputs, the most cyclical part of inflation — durable goods — has run hotter. Conversely, the supply chain’s speeding up created an environment for durable goods deflation from 1995 until COVID-19.
We highlight durable goods pricing because it’s key to determining whether inflation will be transitory. Federal Reserve Chair Jerome Powell singled this out in his Jackson Hole speech (bolding ours): “Booming demand for goods and the strength and speed of the reopening have led to shortages and bottlenecks, leaving the COVID-constrained supply side unable to keep up. The result has been elevated inflation in durable goods—a sector that has experienced an annual inflation rate well below zero over the past quarter century.”
How quickly a different sort of time flies considering Powell’s odds of renomination were closing in on their peak of September 12th’s 92%; as the insider trading scandal has erupted, his odds have fallen to 63% according to PredictIt. But we digress…
September’s 92-day average lead time for production materials was the highest since October 1974 (light blue line), rivaling the episode with the longest lead times in postwar history. Over the 17-month period from June 1973 to October 1974, this buried nugget from the Institute for Supply Management (ISM) manufacturing survey ran at or above the September 2021 level. A year and a half? Sorry folks, that’s not transitory.
The following excerpt from last Friday’s ISM report sheds more light on the supply chain backdrop: It noted that deliveries slowed at a faster rate compared to the previous month, reversing a three-month trend of improvement. Suppliers continued to have difficulties in meeting demand. Five factors were listed including (1) ongoing supplier hiring challenges, (2) extended raw materials lead times at all tiers, (3) increasing levels of input material shortages, (4) stubbornly high prices and (5) inconsistent transportation availability. Rewind a few words. What’s a synonym for “stubborn”? “Persistent.” ISM said it.
Moreover, in September, the percentage of respondents indicating slower supplier delivery times broke above 50% for only the seventh time since the mid-1970s, a 99th percentile event (orange line). Most of these outliers have occurred in a post-pandemic world; we can add the current year’s March, April, May and June to the tally.
Today’s ISM Services report also informs this theme from the broader economy’s vista. The share of participants observing worsening vendor performance has only breached the 50% mark once, during the height of COVID, at 58.3% in April 2020 (green line). Should this metric reach a simple majority again in September, it would be just the second time since the survey’s 1997 inception that breadth was this intense with reference to whole-economy bottlenecks. The difference between 2020 and 2021? Last year was involuntary. This year is not.
History doesn’t repeat itself, but it can rhyme. You can’t make comparisons to the 1970s without incorporating energy prices into the discussion. The Arab oil embargo was the root cause of the 1973-74 oil price shock. Today’s situation is different. But the parallel of persistence would marry the two episodes.
For the entire year of 1974, year-over-year (YoY) gains in spot crude oil prices exceeded 60% for 12 straight months. This duration was duplicated again during the 1979 oil embargo. The current episode has seen the 60% mark exceeded for eight months (including October). An eight-month stretch can be compared more closely to the run-up in oil prices in 2008 during the Great Recession. Should the persistence grow to nine months, then – and only then – can this oil chapter be compared to those of the 1970s.
“Y’all ready for this?” As you see on today’s right chart, U.S. households DO NOT have an energy crisis on their collective radar screens. Bad news heard about an energy crisis barely registered a whisper for years, according to the University of Michigan consumer survey (blue line). Maybe that’s because it’s not trending here. Google Trends U.S. search interest for the term ‘energy crisis’ registered a modest 19 so far in October. Widen the view and worldwide search interest spiked to 100 this month, north of that seen in the Great Recession. Is an energy crisis underpriced here at home? You bet.