10.12.21-Canadian-Labor-Shortages

Canada’s Curve to Stay Flatter

QI TAKEAWAY —  Canada’s labor market has fully recovered. Upstream costs pressures on Main Street point to persistent inflation risks downstream. Watch for Canada’s yield curve to stay flatter than that of the U.S. These rate differentials suggest favoring U.S. banks over Canadian ones.

10.12.21-Canadian-Labor-Shortages

  1. Canada saw 157,000 jobs gained last month, more than 2.5 times the consensus and above every estimate in the Bloomberg survey; the 0.8% MoM pushed employment back to pre-pandemic levels and would have translated to a proportional 1.2 million bump in the U.S.
  2. Unlike in the U.S., Canada’s labor shock appears to have gone a full cycle, with both temporary layoffs and permanent job losers seeing a recovery; labor force participation has returned to 65.5%, and the labor progress made has led the BoC to taper three times already
  3. Per the CFIB, in the six months through September small business’ average price plans over the next year have run north of 3%; at present, CPI trim and CPI median are both above the BoC’s 2% target at 3.3% and 2.6%, respectively, risking cost pressures flowing downstream
10.12.21-Canadian-Labor-Shortages

Filling Potholes

10.12.21-Canadian-Labor-Shortages

VIPs

  • Canada saw 157,000 jobs gained last month, more than 2.5 times the consensus and above every estimate in the Bloomberg survey; the 0.8% MoM pushed employment back to pre-pandemic levels and would have translated to a proportional 1.2 million bump in the U.S.
  • Unlike in the U.S., Canada’s labor shock appears to have gone a full cycle, with both temporary layoffs and permanent job losers seeing a recovery; labor force participation has returned to 65.5%, and the labor progress made has led the BoC to taper three times already
  • Per the CFIB, in the six months through September small business’ average price plans over the next year have run north of 3%; at present, CPI trim and CPI median are both above the BoC’s 2% target at 3.3% and 2.6%, respectively, risking cost pressures flowing downstream


Such is the fastidiousness of Toronto’s bureaucrats, that one can track the number of potholes filled at www.toronto.ca. Thus far in 2021, just 100,432 potholes have been filled, well off the count of the last three years when 163,988, 165,393 and 218,089 were filled in 2020, 2019 and 2018, respectively. Toronto’s road maintenance department explains that the total number of potholes repaired varies from year-to-year depending on winter conditions. A milder winter will have higher number of freeze-thaw cycles, where temperatures fall below freezing and quickly rebound above it, resulting in a higher annual pothole toll. But if it’s freezing all through the winter, the relative dearth of freeze-thaw cycles creates fewer road hazards. Filling potholes might border on sport in Canada’s largest metropolis. It’s such a common occurrence, the City has given its citizens four ways – online form, phone call, tweet, email – to report one to the thorough authorities. The uniqueness of the last 18 months, however, opens the possibility that fewer drivers on the roads made for less wear and tear, culminating in the 39% year-over-year decline in potholes filled.

Regardless of the explanation, there was one pothole filled last Friday that set a significant economic milestone. The Canadian employment pothole has been refilled, regaining its pre-pandemic level with a 157,000 gain that was more than two and a half times greater than consensus and bested every estimate in the Bloomberg survey. For perspective, the 0.8% month-over-month increase would have translated to a proportional 1.2 million advance for U.S. nonfarm payroll employment.

Statistics Canada added some interesting color to the report. First, employment among primary working-aged women (between 25 to 54) was 49,000 (0.8%) above its February 2020 level; a similar take could be told for core-aged men. Second, the numbers of public- and private-sector employees were at or the same timestamp, while a deficit for the self-employed of -241,000 (-8.4%) remained. Third, employment in the service-providing sector surpassed its pre-COVID level in September, while that of the goods-producing sector remained shy by -128,000 (3.2%).

Critically, the labor force participation rate had fully recovered to its former 65.5%, a stark contrast to that of its neighbor to the south. Save the recovery in goods-producing jobs, every one of the details spelled out above are the exact opposite in the U.S. A deeper dive into the Canadian unemployment figures adds even more to the discrepancies between these two USMCA trading partners.

As you see on the left, Canada’s labor shock has gone a full cycle. Measures for both temporary layoffs and permanent job losers have recovered, unlike the corresponding metrics for the U.S. which continue to suffer substantial shortfalls. The spike in the purple line and subsequent sharp fall back reinforces the temporary nature of the COVID shock. The accelerated return to normal for the orange line, however, suggests that the Canadian labor market might be set on mid- to late-cycle and not an early phase recovery.

Canada’s labor progress would qualify as substantial relative to the U.S. It also helps explain why the Bank of Canada (BoC) has tapered three times already. While the labor tailwinds are nice to have, employment is not the central bank’s main mandate. Inflation is.

On that count, price pressures along Main Street, Canada are inducing major impediments to growth. For the month of September, the Canadian Federation of Independent Business (CFIB) reported four significant sources which have combined to juice inflation. CFIB asks participants in its monthly survey, “What factors are limiting your ability to increase sales or production?” The four biggest concerns are shortages of inputs (red line), production distribution constraints (green line), shortages of unskilled labor (blue line) and a similar scarcity of skilled labor (yellow line). All series are depicted as z-scores (deviation from the mean adjusted for volatility) to show how different the current environment is vis-à-vis the past decade.

Sustained supply chain and labor market pressures increase the risk of pass through to small business owners trying to compete for the next slice of revenue against a more challenging backdrop. In the six months through September, Canadian small businesses’ average price plans over the next year (not illustrated) have run north of 3% and ended the half-year period closer to 4%. For context, since this gauge’s February 2009 inception through March 2021, this series 1-3% range has remained within the BoC’s target.

We continue to closely monitor Bloomberg’s Nanos Canadian Confidence Index. This weekly pulse of Canadians has steadily declined since early August and reveals that nearly a third believe the nation’s economy will weaken over the next six months. It won’t matter how the alert is delivered; there’s no paving over Canada’s persistent inflation risk. At present, two out of three of the BoC’s key inflation guides – CPI trim (3.3%) and CPI median (2.6%) – are running north of the 2% target. Upstream cost pressures risk flowing downstream at a time when the labor market has moved from recovery to expansion.

All told, a continued tapering of BoC asset purchases has been reinforced by the latest batch of data. Shorter term rates along the Canadian curve also should remain above those in the U.S. as rate hike expectations are more advanced north of the borders. Substantial labor progress has been made, and inflation is the BoC’s focus. The Canadian yields curve should remain flatter than its U.S. cousin and Canadian dollar bulls should feel more confident in their stance.

10.11.21-production.distribution

Paging the Phillips Curve

QI TAKEAWAY —  Despite a disappointing payroll headline, bullish unemployment trends should force a November taper announcement. Zooming out, the acceleration in wage pressures in the production and distribution chain could be heralding an inflation regime shift. In the near term, a steepener trade would capture that risk.

10.11.21-production.distribution

  1. The unemployed have fallen by 1.8 million in the last three months, a decline that compares solely to 2020’s post-pandemic reopening; permanent job losers are down by 936,000 and account for more than half the improvement, a confidence vote for a sustainable expansion
  2. While September’s gain of 194,000 jobs disappointed, education headcounts fell while total private employment rose by 317,000; though 4.8 million jobs remain to be recovered, the yield curve steepened, signaling the Fed should be on track to launch its taper in November
  3. Wages for production/distribution workers have seen an 8.4% annualized gain in the six months ended September, the highest since the early 1980s; small businesses are also feeling pressure, per Paychex, seeing three-month annualized gains between 5.2% and 5.4%
10.11.21-production.distribution

Rooster Unemployment

10.11.21-production.distribution


VIPs

  • The unemployed have fallen by 1.8 million in the last three months, a decline that compares solely to 2020’s post-pandemic reopening; permanent job losers are down by 936,000 and account for more than half the improvement, a confidence vote for a sustainable expansion
  • While September’s gain of 194,000 jobs disappointed, education headcounts fell while total private employment rose by 317,000; though 4.8 million jobs remain to be recovered, the yield curve steepened, signaling the Fed should be on track to launch its taper in November
  • Wages for production/distribution workers have seen an 8.4% annualized gain in the six months ended September, the highest since the early 1980s; small businesses are also feeling pressure, per Paychex, seeing three-month annualized gains between 5.2% and 5.4%


Levi Hutchins lived firmly by one rule: Wake before sunrise – 4:00 a.m. to be exact. Listening to the early bird inside his head, this American invented the mechanical alarm clock in 1787. Of his design, he said, “It was the idea of a clock that could sound an alarm that was difficult, not the execution of the idea. It was simplicity itself to arrange for the bell to sound at the predetermined hour.” It would seem Hutchins was more interested in beating the rooster than benefiting monetarily — he never secured a patent. And though a half a century on, Frenchman Antoine Redier did patent an adjustable alarm clock, it didn’t make it across the ocean leaving American Seth E. Thomas to stake legal claim to his own version in 1876. His eponymous company mass-produced the alarm clock, delivering the innovation to the general public and putting roosters out of business once and for all.

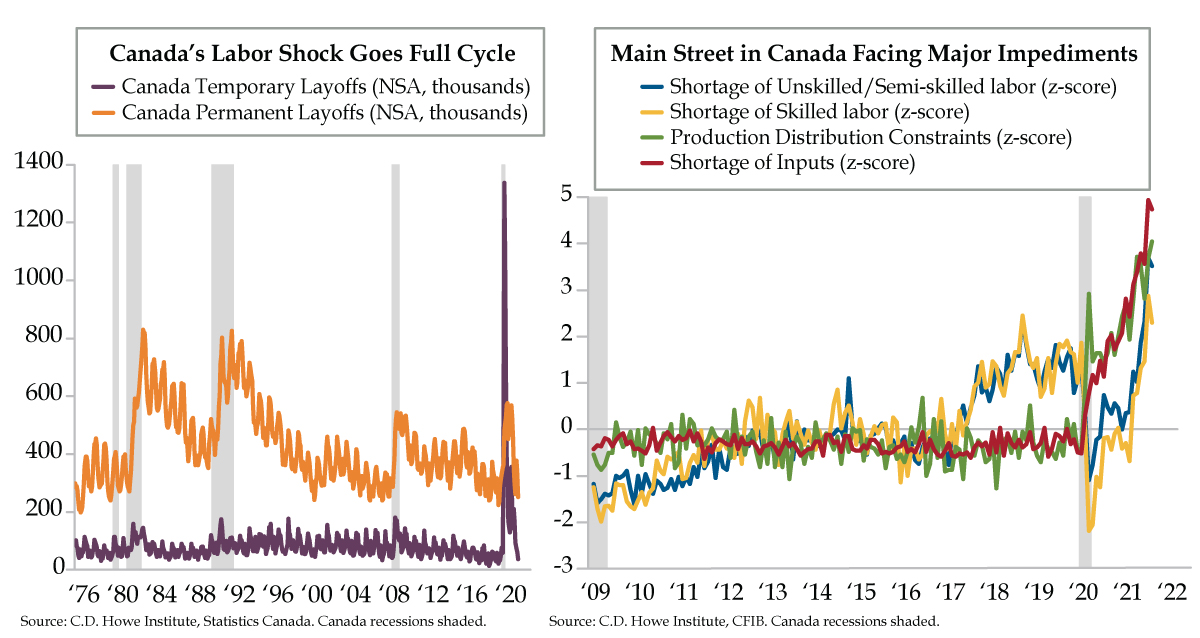
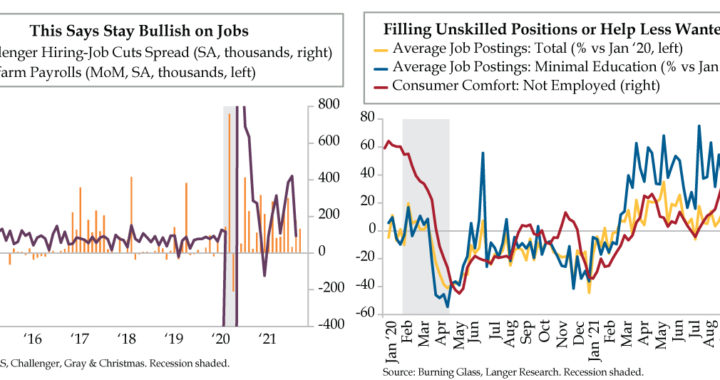
Speaking of unemployment lines, they’ve shortened considerably. July, August and September yielded decreases in the total unemployed of 782,000, 318,000 and 710,000, respectively. The three-month cumulative 1.8-million decline compares solely to 2020’s post-pandemic reopening. Permanent job losers, down an unmatched 936,000 over this period, accounted for half the improvement, a confidence vote for a sustainable expansion.

For the official unemployment rate, the 1.1 percentage point drop in the three months ended September has pre-pandemic precedent in the 1950s. This year, there’s also a voluntary aspect to the rise in labor resource utilization, especially with the cessation of special unemployment checks across many states shifting the opportunity cost, shall we say, to collecting a paycheck again.

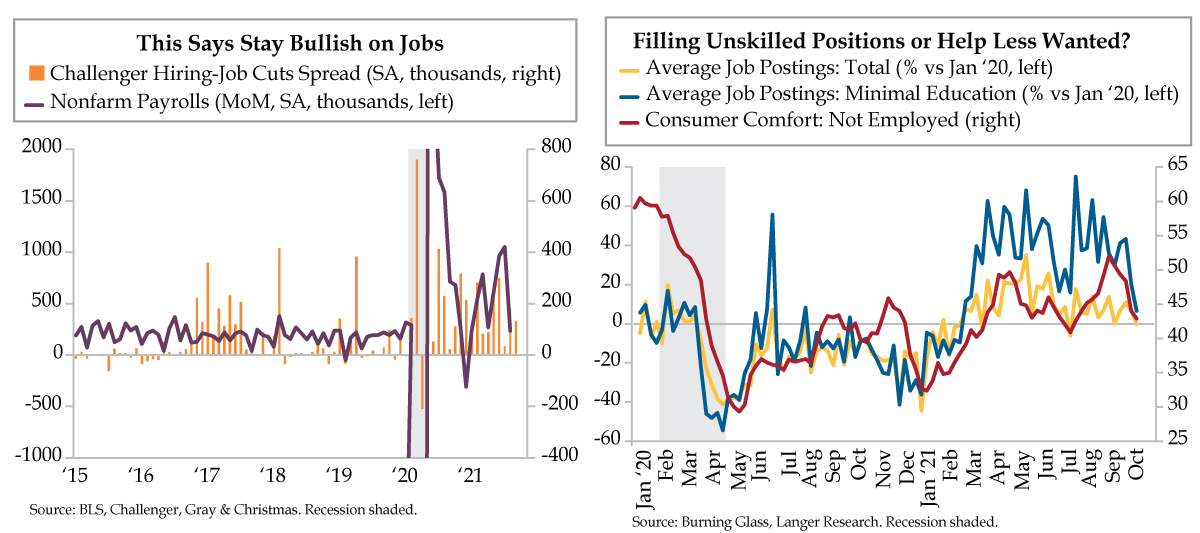
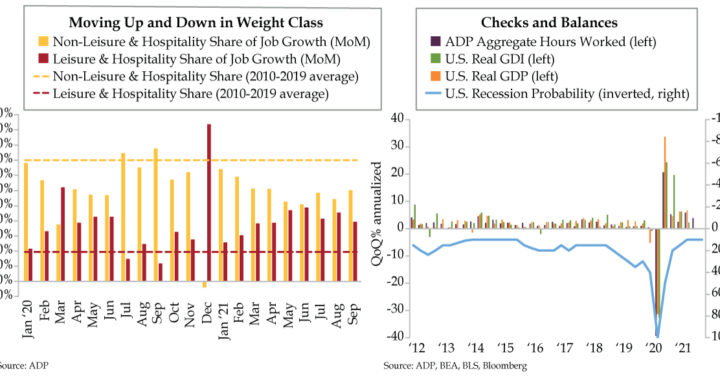
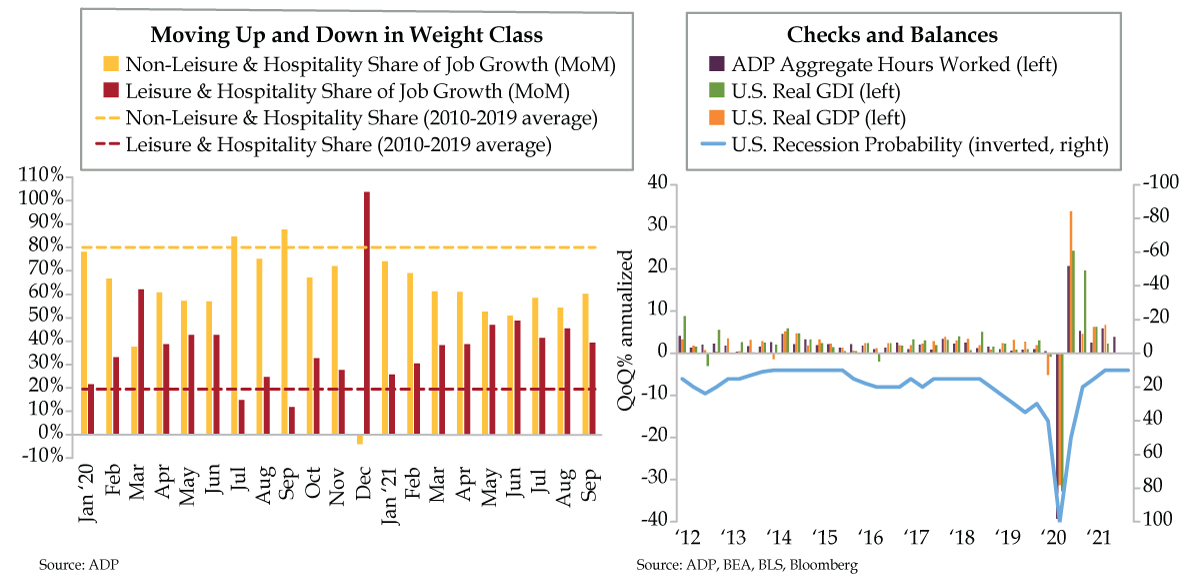
We’re not dismissing the “disappointment” in September nonfarm payrolls (NFP). The 194,000 advance was light versus the 500,000 consensus. A closer look revealed literally and figurately got schooled. In a reversal of July’s massive seasonal upside in the sector, both public and private education headcounts declined. At 317,000, private employment did all the lifting, which gets you closer to the forecast with the caveat, via QI friend and labor guru Philippa Dunne, that the print is still 335,000 below the last three months’ private sector average.

To Jerome Powell’s chagrin, the yield curve steepened, signaling the Fed should remain on track to launch its taper November 3rd. Not even the most dovish monetary policymaker can refute the 5.05 million total nonfarm jobs added thus far in 2021, a record in absolute terms for a first-nine-months stretch. With a remaining deficit of 4.8 million jobs still to be recovered, the biggest unknown is whether we’re as far away from full pre-pandemic employment levels as recent numbers would suggest. If this gap fills, the specter of persistent wage inflation could force the Fed to tighten more aggressively and expeditiously than markets anticipate.

Last Tuesday, we used ISM’s production material commitment lead times to warn that a parallel with the 1970s energy crisis could be in the making. The Disco era also taught us that new inflation regimes require a confluence of factors, not just higher input and freight costs. We’d be remiss on this last point to omit signs that freight charges may be peaking. With a hat tip to QI fishing buddy Brent Donnelly, a reliable real-time way to track shipping is through the share prices of Cosco and Maersk, two of the world’s three biggest shipping companies. Of late, Cosco has failed to make new highs while Maersk did take out its June highs, but has since slipped below that level.

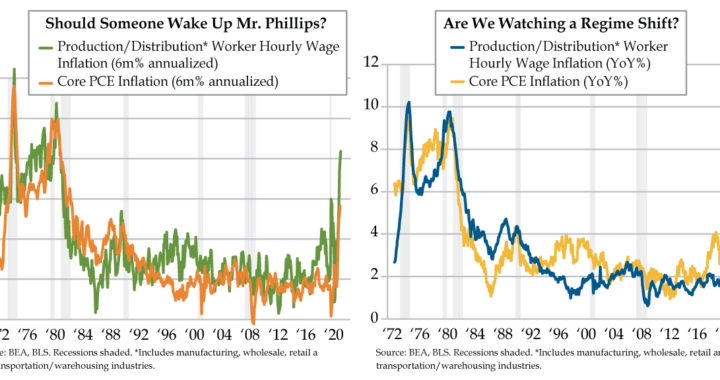
This potential tide turn does not negate the need to be alert to the missing ingredient of higher wages. At first glance, today’s charts may look like twins. Upon closer inspection, the left one depicts short-term trends (i.e., six months) and the right, the more conventional 12-month comparison.

Companies closest to the supply chain are battling the fiercest wage pressures. As defined, workers in production and distribution include the cyclical industries of manufacturing, wholesale, retail and transportation & warehousing. Usually, we track wages in these industries separately as they’re reported individually by the Bureau of Labor Statistics. Aggregating them culminates in an 8.4% annualized gain in the six months ended September (green line), the highest since the early-1980s. Could the rise in the Fed’s preferred underlying inflation gauge, the core PCE price index (orange line), be attributable to more than a handful of anomalous items?

Wage data from payroll provider Paychex confirms the recent surge is more than a big company phenomenon. Paychex small business wage data through September showed three-month annualized gains of between 5.6% and 5.8% for the industries cited above. Over a 12-month span, the advances range between 4.2% and 4.7%. The asterisk is these levels are margin killers and could flag employers hitting their pain thresholds, which is also evident in persistently high hours worked, which indicates an unwillingness to take on more workers by squeezing more out of existing employees. Per Dunne, hiring healing still has a long haul ahead: “To get back to February 2020’s Employment to Population Ratio of 61.1%, we’d need to add another 6.4 million jobs.”

A chat with a high yield portfolio manager by QI’s Dr. Gates bound the macro to the micro, which is essential to making inflation persistence stick. Think of the python that ate not one, but three pigs — material, transport and wagecosts.” Perhaps

Payrolls Should Pop. That Won’t Be Welcomed by Powell

QI TAKEAWAY —  The cheaper volatility is, the more you should load up on it. The debt ceiling is anything but “resolved” and the Fed is backed into its tightest corner ever as it’s not traditionally eased or tightened if either could be construed as playing politics.

  1. Mitch McConnell has agreed to go along with raising the debt ceiling by $480 million, keeping things open through early December; while this gives time for Democrats to raise it again through reconciliation, negotiations between party factions remain a roadblock
  2. Challenger’s Hiring-Layoff announcement spread remains robust, and the series’ correlation with nonfarm payrolls suggests a September gain near the consensus 500,000; however, strength could put added pressure on Powell at his November presser to announce tapering
  3. Per Burning Glass, nationwide job postings have slipped into negative territory vs. January 2020 levels for the first time in three months; meanwhile, job postings requiring “Minimal Education” are up just 6.5%, the lowest print since February and well off May’s 68.2% peak


Birds Anonymous

VIPs

  • Mitch McConnell has agreed to go along with raising the debt ceiling by $480 million, keeping things open through early December; while this gives time for Democrats to raise it again through reconciliation, negotiations between party factions remain a roadblock
  • Challenger’s Hiring-Layoff announcement spread remains robust, and the series’ correlation with nonfarm payrolls suggests a September gain near the consensus 500,000; however, strength could put added pressure on Powell at his November presser to announce tapering
  • Per Burning Glass, nationwide job postings have slipped into negative territory vs. January 2020 levels for the first time in three months; meanwhile, job postings requiring “Minimal Education” are up just 6.5%, the lowest print since February and well off May’s 68.2% peak


“I wouldn’t do that if I were you. If I were you, I’d put him back. It can only lead to self-destruction. It only takes one bird to start you, and before you know it, it’s two birds, then three. Suddenly without realizing it, you’re a victim. Then one day…the end of the road.”

Clarence, Birds Anonymous, Looney Tunes, 1957


The moral: Always think twice before taking that first step into the abyss. While we look back and smile at Sylvester’s being talked back from the ledge, presumably saving Tweety Bird a horrific fate, Clarence’s guidance might have been inspired by a real-world event. On November 16, 1952, the Victoria Advocate ran a story accompanied by a photo of a kitty with a most chagrined look on its face. A random accident – a stray cat locked into a department store overnight – culminated with store officials happening upon the accused feline sitting at the side of what had been a toppled cage that had once housed five canaries, with its spring door sprung open. The only witness to the massacre was a lone canary in an elevated cage.

The phrase, “the cat that ate the canary” has since become a prized purview of political columnists. Though we’ve not yet read today’s recap, an astute Beltway veteran of the press should have ascribed this characterization to one Mitch McConnell in recapping the last few tumultuous weeks on the Hill. While the stock market breathed a huge sigh of relief, shrewd politicos didn’t dare declare victory for one side or the other. For weeks, the Democrats have decried the lack of time to raise the debt ceiling via reconciliation – which only requires 50 Senate votes straight up on party lines. No doubt, this more arduous path requires weeks, if not a month. Still, Senate Majority Leader Schumer was posturing, knowing he’d say and do anything to avoid having his party “own” a $7 trillion increase in the debt ceiling.

And so, with a canary feather barely visibly escaping his lips, McConnell graciously offered $480 billion to keep the U.S. government running through December 3rd and all the time the Democrats need to increase the debt limit between now and then…all by themselves. Will this time resolve the fissures that have opened within the Democratic party? Will a compromised, slimmed down social spending bill’s crafting be assured despite progressives losing their green initiatives and tax hikes to achieve resolution? We ask your indulgence and reply, “Hell no!” But it was time that was “requested,” and time delivered on the part of the GOP. Would McConnell repeat this ruse every two months all the way up to the Midterm elections? With further indulgence, “Hell yes!”

Into this political maelstrom steps one Jerome Powell who went to sleep last night praying for a weak jobs report. Say what you will about his Put being bigger than any of his predecessors. Be that as it may, the chair of the Federal Reserve respects the institution. To uphold its (false) image of being apolitical, the Fed holds tight to the tradition of not making any major policy changes when there’s brinksmanship on steroids in D.C. For good measure, December is a nonstarter as it’s unseemly to change policy with the holidays upon us.

Today’s left chart, however, suggests Powell will be in something of a pickle come November 3rd, when he’s next prompted to the podium for a post-FOMC presser. The last time he was at that same virtual post, he pledged to pull the taper trigger at the November meeting if this morning’s nonfarm (NFP) payrolls did not disappointment. Given Challenger’s hiring announcements are still relatively robust vis-à-vis layoffs (orange line vs purple line), the two series’ historical co-movement suggests monthly payrolls should not leave the consensus, which has coalesced around a neat gain of 500,000, despondent. Bloomberg figures the headline print could come in at half that level and still satisfy the “substantial further progress” criteria.

Zooming in closer to weekly data points for clues, what we should expect regardless of where that top line figure comes in is a welcome increase in the labor force participation rate. Let’s start with the not so chipper set. As you see in the red line, per Langer’s weekly consumer comfort data, the mood amongst those who are not gainfully employed has fallen to the lowest since mid-July. The flip side is in the job postings data. According to Burning Glass, against a benchmark of January 2020, nationwide job postings (yellow line) have slipped into contraction for the first time since this past July.

Before drawing any conclusions about a July pattern forming, the newest news we painted in today’s right graph was in the color of blue. While still up by 6.5%, the last time jobs requiring “Minimal Education” were so infirm was February. To think that in mid-May, these Help Wanted postings (the ones you see around your neighborhoods on handwritten signs) were up a post-pandemic peak of 68.2%.

Those hard-to-fill vacancies appear to be less vacant, and that’s a good thing. If you want validation, focus on this morning’s workweek – that’s where our sights will be set. In the meantime, we’ve got popcorn and a front row seat to what the naïve portray as Kabuki theater in the U.S. capitol. As we’ve long maintained, Minority Leader McConnell is in it to win it.


The World is Not Ending Today

QI TAKEAWAY —  ADP beat all but one forecast in the Bloomberg survey. This should keep the Fed on track for a November taper and a curve flattening in play. The curve ball is the GOP’s détente suggestion that the debt ceiling be resolved next month via reconciliation; the “gift” of the extra month diffuses Democrats claims that they don’t have adequate time to increase the debt ceiling along party lines by the ‘X’ date of October 18th.

  1. Since April 2020, roughly 40% of job gains have come from leisure & hospitality, per ADP, well above the 20% average from 2010-2019; meanwhile, non-leisure has underperformed in the post-pandemic environment, seeing just 60% of job gains vs. 80% in the decade prior
  2. ADP’s September payroll report saw a gain of 568,000, well above August’s initially reported 330,000; sectors underperforming headline growth included professional services and trade/transportation while manufacturing, education, and healthcare outperformed
  3. Since 2006, ADP Aggregate Hours Worked have had correlations of 0.9 and 0.88 to real GDP growth and real GDI growth, respectively; assuming the workweek is unchanged at 34.7 hours from August, ADP suggests a 4% QoQ annualized rate of expansion in Q3

Spiderman, Princesses and Batman

VIPs

  • Since April 2020, roughly 40% of job gains have come from leisure & hospitality, per ADP, well above the 20% average from 2010-2019; meanwhile, non-leisure has underperformed in the post-pandemic environment, seeing just 60% of job gains vs. 80% in the decade prior
  • ADP’s September payroll report saw a gain of 568,000, well above August’s initially reported 330,000; sectors underperforming headline growth included professional services and trade/transportation while manufacturing, education, and healthcare outperformed
  • Since 2006, ADP Aggregate Hours Worked have had correlations of 0.9 and 0.88 to real GDP growth and real GDI growth, respectively; assuming the workweek is unchanged at 34.7 hours from August, ADP suggests a 4% QoQ annualized rate of expansion in Q3


Halloween’s origins date back to the ancient Celtic festival of Samhain (pronounced sow-in). The Celts, who thrived 2,000 years ago, celebrated their new year on November 1. This day marked the end of summer and harvest and the beginning of the dark, cold winter, which was often associated with human death. Celts believed that on the night before the new year, the boundary between the worlds of the living and the dead became blurred. On the night of October 31, they celebrated Samhain, when it was believed that the ghosts of the dead returned to earth. Over time, Halloween evolved into a day of activities like trick-or-treating, carving jack-o-lanterns, festive gatherings, and especially, donning costumes. According to the National Retail Federation’s Annual 2021 Halloween Spending Survey, 2021’s top three costumes entail more than 1.8 million children dressing as Spiderman, about 1.6 million as their favorite princess, and roughly 1.2 million as Batman.

The act of outfitting economics can require costumes be donned for long calendric periods. At times, entrenched trends can be dislodged for extended periods, measured in months or years. The COVID-19 pandemic shock qualifies as one such disruptor. Eighteen months after landing on U.S. shores, its ripple effects are still evident. Yesterday’s ADP employment report is a case in point.

The leisure & hospitality (L&H) sector was ground zero for the pandemic, which we would add has been a global phenomenon. We know we’re not breaking any new ground here. But for an industry that made up 13% of total private payrolls before the pandemic, a disproportionate 40% of the total job losses at the height of the health crisis in March and April of 2020 were in this area. From that point forward, an average of 40% of the job gains in the post-COVID recovery also came from this heavily consumer-facing part of the labor market (red bars). This was twice the average over the prior economic expansion from 2010 to 2019 (red dashed line). L&H didn’t just get into costume, it’s been punching above its weight class.

For completeness, the contribution to the recovery in private employment by industries outside of L&H stepped down in class over the last 18 months. Non-L&H job growth accounted for six in ten private payroll jobs on average (yellow bars), a notable step down from the eight in ten (yellow dashed line) that prevailed over the prior decade.

To put the labor cycle into perspective, we also use a simple calculation that projects the current month’s gain in ADP forward until the level of employment reaches full recovery. August’s initially reported 330,000 advance projected January 2023 as the month when the hole from COVID would completely be filled. September’s 568,000 gain shortened that timeframe to July 2022.

Let’s go granular. Taking this analysis down one level to the major sectors, L&H is the only one consistent with the headline number. Outperformers, or industries that would recover sooner, include construction, financial, natural resources, education, manufacturing and health care. Underperformers, or industries that would recover later, include “other” services, professional & business services, trade/transportation/utilities and information.

ADP’s claim to fame is as a guide for the granddaddy of all economic indicators — nonfarm payrolls (NFP). The ADP report allows for a recalculation by some forecasters two days before NFP hits the tape. As of this writing, the median of those restating their payroll calls was 550,000. This whisper number compares to the 488,000 consensus from all other economists who didn’t hit the rewrite button yesterday.

ADP also can be used as part of a checks and balances exercise for the near-term economic outlook. To clarify a point made in our prior missive, the slowdown narrative mentioned was not meant to generate a recession scare, the likes of which would bring out the Street’s Chicken Littles. It was done to call attention to the potential misalignment of consensus expectations and the surprise factor that could unfold when chasing forecasts down becomes more visible.

The coming downshift in U.S. growth can be confirmed – or denied – by observing the path of aggregate hours worked in monthly payrolls data. This labor input, which is the number of jobs times the average workweek for the private sector, is a well-regarded leading indicator. ADP’s early release can proxy the official data.

The sky is not falling. As illustrated in the purple bars and assuming the workweek is unchanged at 34.7 hours, ADP suggests a 4% quarter-over-quarter annualized rate of expansion in the third quarter. Since 2006, the ADP figure has a .90 correlation to real GDP growth (orange bars) and a .88 correlation to real GDI (gross domestic income, green bars) growth, the latter of which is a check against headline GDP.

We would add that at a purely intuitive level, something would be deeply amiss if we had not seen a pop in ADP job gains in the month supplemental jobless benefits programs expired. We already know consumption is falling among those who have not taken vacancies. We don’t think the U.S. economy is at the beginning of a dark, cold winter. However, the priced-to-perfection cycle low recession probability at 10% (inverted blue line) is likely at risk once the slowdown narrative is completely digested.