VIPs
- Canada saw 157,000 jobs gained last month, more than 2.5 times the consensus and above every estimate in the Bloomberg survey; the 0.8% MoM pushed employment back to pre-pandemic levels and would have translated to a proportional 1.2 million bump in the U.S.
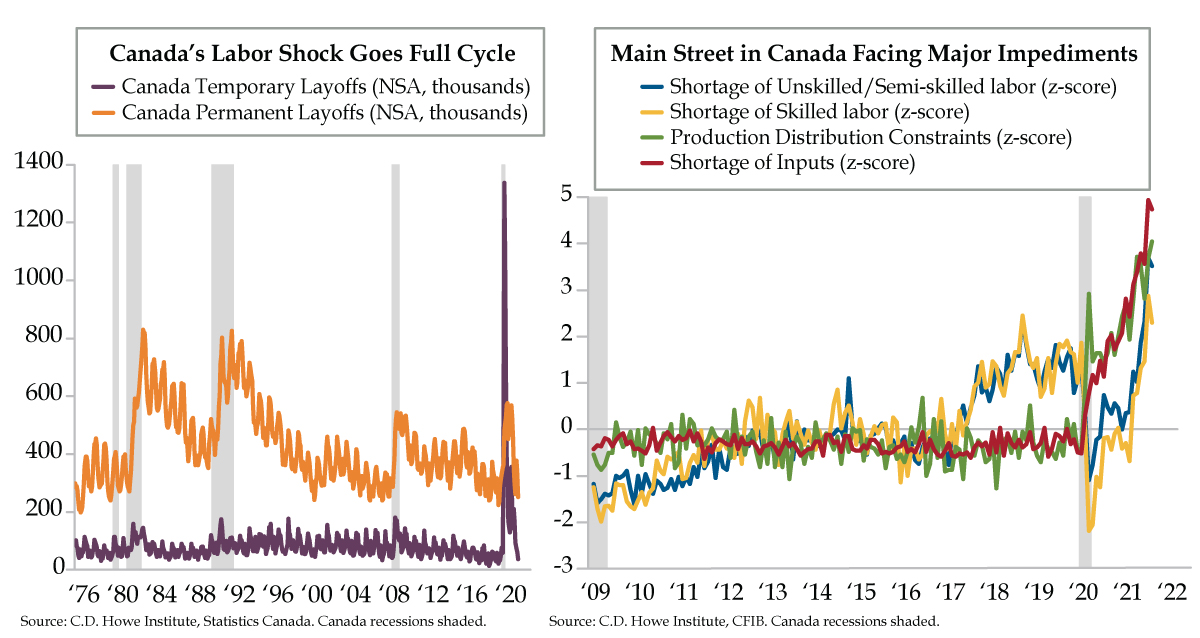
- Unlike in the U.S., Canada’s labor shock appears to have gone a full cycle, with both temporary layoffs and permanent job losers seeing a recovery; labor force participation has returned to 65.5%, and the labor progress made has led the BoC to taper three times already
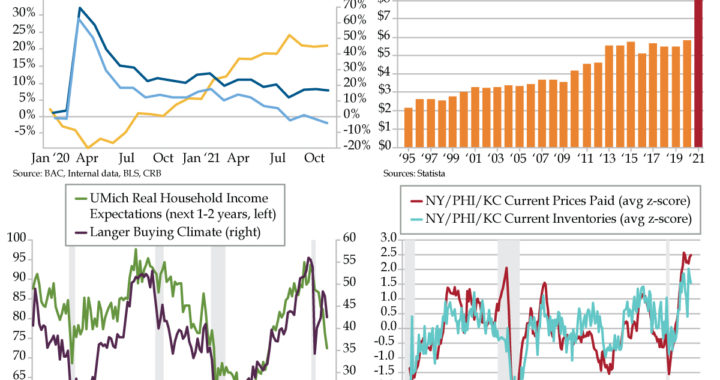
- Per the CFIB, in the six months through September small business’ average price plans over the next year have run north of 3%; at present, CPI trim and CPI median are both above the BoC’s 2% target at 3.3% and 2.6%, respectively, risking cost pressures flowing downstream
Such is the fastidiousness of Toronto’s bureaucrats, that one can track the number of potholes filled at www.toronto.ca. Thus far in 2021, just 100,432 potholes have been filled, well off the count of the last three years when 163,988, 165,393 and 218,089 were filled in 2020, 2019 and 2018, respectively. Toronto’s road maintenance department explains that the total number of potholes repaired varies from year-to-year depending on winter conditions. A milder winter will have higher number of freeze-thaw cycles, where temperatures fall below freezing and quickly rebound above it, resulting in a higher annual pothole toll. But if it’s freezing all through the winter, the relative dearth of freeze-thaw cycles creates fewer road hazards. Filling potholes might border on sport in Canada’s largest metropolis. It’s such a common occurrence, the City has given its citizens four ways – online form, phone call, tweet, email – to report one to the thorough authorities. The uniqueness of the last 18 months, however, opens the possibility that fewer drivers on the roads made for less wear and tear, culminating in the 39% year-over-year decline in potholes filled.
Regardless of the explanation, there was one pothole filled last Friday that set a significant economic milestone. The Canadian employment pothole has been refilled, regaining its pre-pandemic level with a 157,000 gain that was more than two and a half times greater than consensus and bested every estimate in the Bloomberg survey. For perspective, the 0.8% month-over-month increase would have translated to a proportional 1.2 million advance for U.S. nonfarm payroll employment.
Statistics Canada added some interesting color to the report. First, employment among primary working-aged women (between 25 to 54) was 49,000 (0.8%) above its February 2020 level; a similar take could be told for core-aged men. Second, the numbers of public- and private-sector employees were at or the same timestamp, while a deficit for the self-employed of -241,000 (-8.4%) remained. Third, employment in the service-providing sector surpassed its pre-COVID level in September, while that of the goods-producing sector remained shy by -128,000 (3.2%).
Critically, the labor force participation rate had fully recovered to its former 65.5%, a stark contrast to that of its neighbor to the south. Save the recovery in goods-producing jobs, every one of the details spelled out above are the exact opposite in the U.S. A deeper dive into the Canadian unemployment figures adds even more to the discrepancies between these two USMCA trading partners.
As you see on the left, Canada’s labor shock has gone a full cycle. Measures for both temporary layoffs and permanent job losers have recovered, unlike the corresponding metrics for the U.S. which continue to suffer substantial shortfalls. The spike in the purple line and subsequent sharp fall back reinforces the temporary nature of the COVID shock. The accelerated return to normal for the orange line, however, suggests that the Canadian labor market might be set on mid- to late-cycle and not an early phase recovery.
Canada’s labor progress would qualify as substantial relative to the U.S. It also helps explain why the Bank of Canada (BoC) has tapered three times already. While the labor tailwinds are nice to have, employment is not the central bank’s main mandate. Inflation is.
On that count, price pressures along Main Street, Canada are inducing major impediments to growth. For the month of September, the Canadian Federation of Independent Business (CFIB) reported four significant sources which have combined to juice inflation. CFIB asks participants in its monthly survey, “What factors are limiting your ability to increase sales or production?” The four biggest concerns are shortages of inputs (red line), production distribution constraints (green line), shortages of unskilled labor (blue line) and a similar scarcity of skilled labor (yellow line). All series are depicted as z-scores (deviation from the mean adjusted for volatility) to show how different the current environment is vis-à-vis the past decade.
Sustained supply chain and labor market pressures increase the risk of pass through to small business owners trying to compete for the next slice of revenue against a more challenging backdrop. In the six months through September, Canadian small businesses’ average price plans over the next year (not illustrated) have run north of 3% and ended the half-year period closer to 4%. For context, since this gauge’s February 2009 inception through March 2021, this series 1-3% range has remained within the BoC’s target.
We continue to closely monitor Bloomberg’s Nanos Canadian Confidence Index. This weekly pulse of Canadians has steadily declined since early August and reveals that nearly a third believe the nation’s economy will weaken over the next six months. It won’t matter how the alert is delivered; there’s no paving over Canada’s persistent inflation risk. At present, two out of three of the BoC’s key inflation guides – CPI trim (3.3%) and CPI median (2.6%) – are running north of the 2% target. Upstream cost pressures risk flowing downstream at a time when the labor market has moved from recovery to expansion.
All told, a continued tapering of BoC asset purchases has been reinforced by the latest batch of data. Shorter term rates along the Canadian curve also should remain above those in the U.S. as rate hike expectations are more advanced north of the borders. Substantial labor progress has been made, and inflation is the BoC’s focus. The Canadian yields curve should remain flatter than its U.S. cousin and Canadian dollar bulls should feel more confident in their stance.