VIPs
- The median price of a single-family new home rose to a record $390,900 in August, an unprecedented 26% jump from April 2020; as a result of affordability challenges, UMich’s consumer home buying conditions index has held at record levels of negativity since May
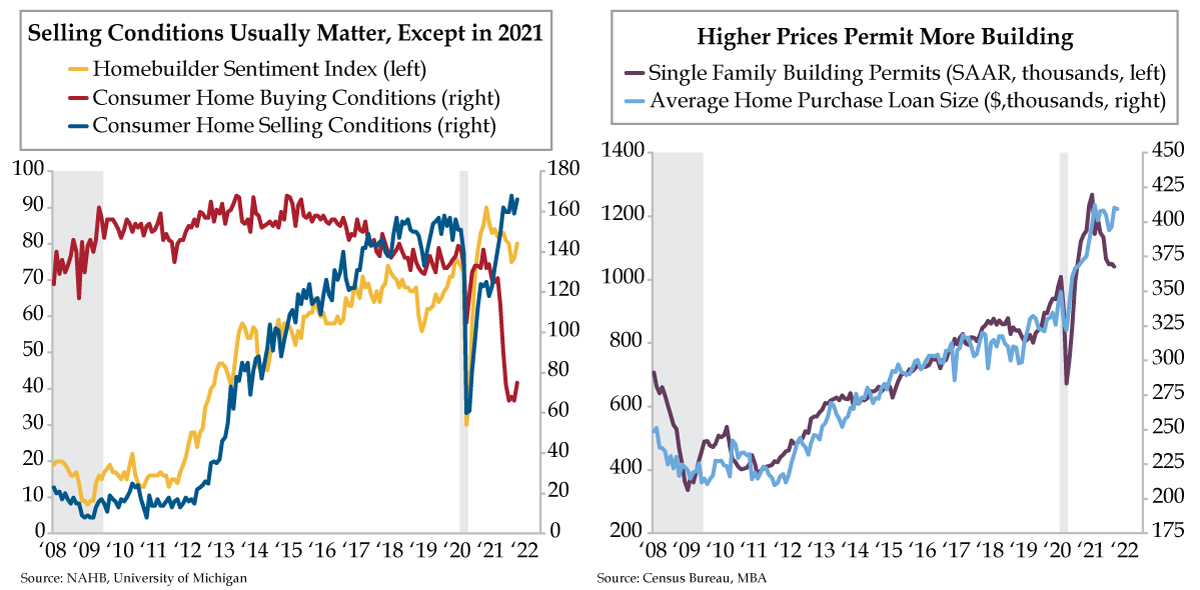
- Since 1993, the National Association of Home Builders’ sentiment index has had a 0.92 correlation with UMich home selling conditions vs. 0.08 with buying conditions; in the last 12 months, that correlation has flipped to -0.77 and 0.81 for selling and buying conditions
- Historically, the MBA’s average home purchase loan size has tracked with single family building permits; loan size appears to have stalled around $400,000, while single family permits fell back in September to July 2020 levels in the face of retracting demand
“I assume that Congress fully understands that the fur industry cannot, and would not if it could, pay this tax, wherever it is placed. If conditions improve enough to create a seller’s market, the tax will be passed on, with costs to the consumer, in the retail price. If conditions remain as they are, namely, getting worse by the day, the tax will come out of the farmer’s pocket.” – David C. Mills, Director of the American Raw Fur Institute (Revenue Act of 1932 hearings before the U.S. Senate Finance Committee). As defined, a “seller’s market” is a market in which goods are scarce, buyers have a limited range of choice and prices are high. As Mr. Mills argued to the Committee, the tax was aimed at the “well-to-do” but would fly “straight as an arrow at the poorest people in the country,” the fur farmer. And so it was.
Home builders are no fur farmers. They construct the largest financial commitment the average U.S. household makes. The median price of a single-family new home rose from a post-COVID 19 low of $310,100 in April 2020 to a record high $390,900 this past August. Historically speaking, the 26% advance over the 16-month stretch was an extreme; the sole precedents are episodes in 1973 and 2013. Even the outsized 14% gain in personal income, excluding transfer payments over the same period, didn’t match the home price spike.
This discrepancy highlights the specter of housing affordability. While not directly comparable to the new home market, the National Association of Realtors (NAR) Housing Affordability Index, which gauges homebuyers’ wherewithal to finance median-priced homes fell more than 17% in that same April 2020 to August 2021 span. Moreover, demand challenges presented by higher home prices drove the University of Michigan’s (UMich) consumer home buying conditions index to a net atrocious time to buy setting in May of this year. Most remarkably, it’s sustained this intense negativity for the six months through October (red line).
Usually, home builders don’t blink at variations in home buying conditions. Since the inception of the UMich home selling conditions index in November 1992, the correlation to the National Association of Home Builders (NAHB) home builder sentiment index has been a stout .92. Alternatively, the same calculation against home buying conditions was .08.
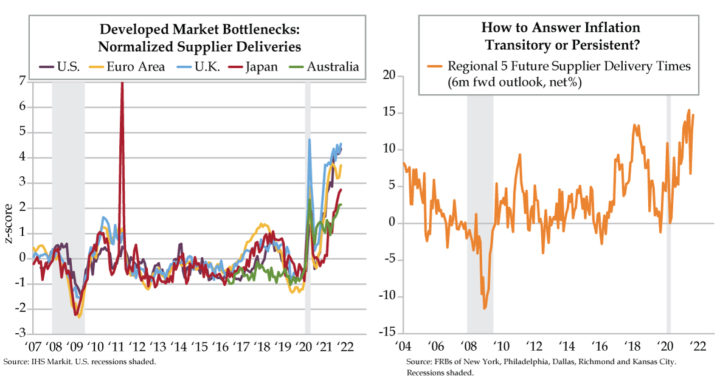
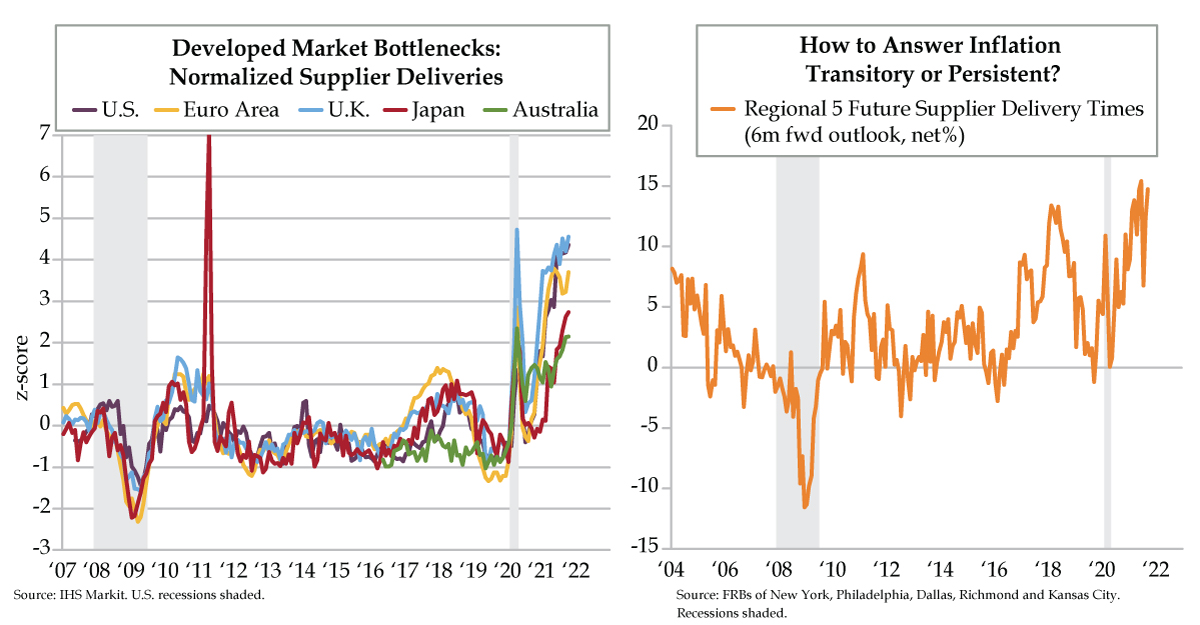
There’s nothing like a global pandemic to further snarl a supply chain that was already a mess thanks to that first Trump tweet that ignited a trade war, which so few can recall sent world trade into contraction for the full year 2019. The supply chain being turned upside down in 2021 has altered the dynamic on the homebuilding front. Not only did confidence hit an all-time high last November; in the subsequent 12 months through October, the historical correlation has flipped — buying conditions scored 0.81 (previously .08), and selling conditions nosedived to a -.77 (from that ‘stout’ +0.92).
Though buying conditions have mattered more than selling conditions of late, this hasn’t staunched home builders’ optimism. They are sellers. Sellers love to sell in a rising market, especially one where supply constraints are not easily rectified and are likely to persist — it makes for more profitable transactions even if you are selling fewer units…up to a point, which few homebuilding cowboys remember from past cycles.
NAHB Chairman Chuck Fowke characterized conditions as such: “Although demand and home sales remain strong, builders continue to grapple with ongoing supply chain disruptions and labor shortages that are delaying completion times and putting upward pressure on building material and home prices.” Read between the lines — home builders are passing higher costs along to buyers.
No doubt, the Fed’s keeping emergency settings for $40 billion per month in mortgage-backed securities of quantitative easing (QE) has overheated the housing market. Home prices are the smoking gun. Homebuilders’ perspective is, however, as such: falling joblessness equates to household creditworthiness becoming more worthy with every one-tenth decline in the official unemployment rate. It’s a classic right-tail problem of higher inflation, not a textbook left-tail problem of higher unemployment.
You know we’re incapable of presenting one side of the story. A fresh body of work we’re undertaking at QI is accelerated automation eradicating untold millions of U.S. jobs from the workforce. Topping that premise is an exhaustive analysis undertaken by QI guru Dennis McGill of Zelman Associates on demographics that runs the gamut from who we’ve lost in terms of would-be buyers to an epidemic of young deaths to the extraordinary, and growing, ranks of adults living with and multi-generationally bunking up with their parents, to the nearly 750,000 Americans whose lives have been taken by COVID-19.
With this as backdrop, the Mortgage Bankers Association (MBA) average home purchase loan size (light blue line) first breached the $400,000 threshold in 2021. While this series has consistently predicted single-family building permits (purple line) and the average home purchase loan size has leveled off, it’s yet to signal a down cycle. Getting to that point would require crimped demand, increased supply or some combination thereof (welcome to where we are today).
Join the masses — assign the pull-back in September single family permits to a July 2020 low to idiosyncratic and unforgiving Hurricane Ida. You’d be joined by builders, especially of the publicly traded nature, who won’t retract their shovels despite macroeconomic headwinds, even in the face of supply chain and labor challenges.