VIPs
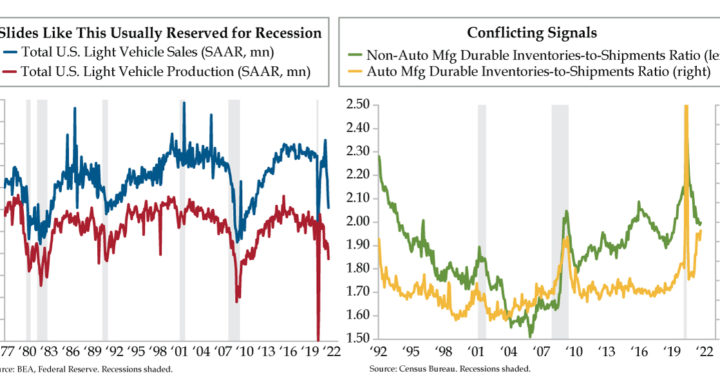
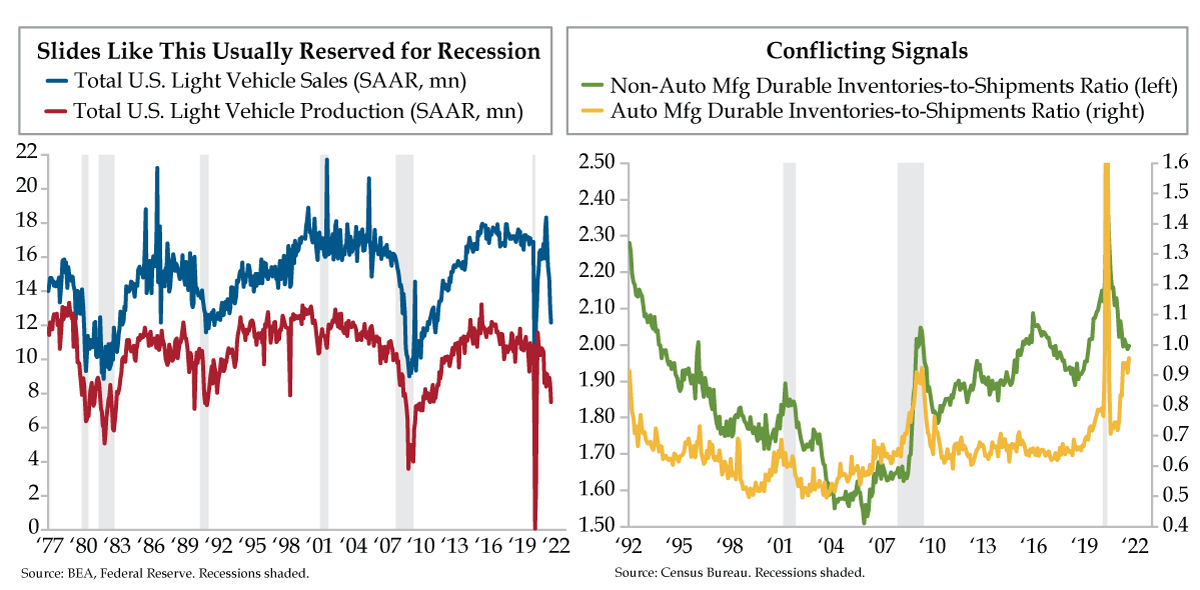
- Since peaking in July 2020 at a 11.5 million SAAR, U.S. Light Vehicle Production has fallen to a 7.5 million pace, the worst since March 2020; meanwhile, October is set to mark a 6th consecutive month of falling Light Vehicle Sales, not seen since the height of the GFC
- At 0.96, the Inventories-to-Shipments Ratio for Autos is at its highest since May 2020, while the same ratio for Non-Autos has slipped from 2.4 in April to 2.0; the latest prints of the Empire State and Philly Fed Mfg. surveys confirm a rise in inventories and urge to stockpile
- Though Deloitte projects a 5% rise in holiday spending vs. 2020, the higher-income cohort plans to spend 15% more vs. 22% less by the lower-income cohort; absent a further stimulus injection, the threat of continued weakness remains due to demand being pulled forward
Tails don’t hold a candle to outliers, defined as observations that lie an abnormal distance from other values in a random sample. The key to identifying abnormality is defining normality, which involves the bell curve. In business school Statistics, outliers were living, breathing human beings – those engineering undergraduates from the Midwest who played rugby by day, partied all night, slept through their classes and could only be bothered with waking to take exams. Once the test results were announced, these outwardly seeming slouches inevitably ‘blew the curve’ and promptly fell back asleep to store energy for the long night of beer-bonging that awaited. While there was little in the way of controversy surrounding these irritants cum curve blowers, historical statisticians have long debated the deeper question of whether we’re living an outlier existence borne of no world wars since 1945. Statistically speaking, despite the uber-violent century that preceded World War II, peace would have to persist for another hundred years before our mutual existence could be classified as a historical outlier.
Conversely, weather, economic data and financial market valuations haven’t escaped outlier territory for years, which is oxymoronic. Be that as it may, Texas has frozen solid three times in the last decade tossing the notion of 100-year storms on its arse. Real yields on junk bonds out to the furthest tenor on the maturity spectrum are negative. And fiscal and monetary policy generated a flash recession that practically ended before it began inducing the biggest demand pull-forward in the history of U.S. consumption. Yesterday, QI’s Dr. Gates identified yet another outlier, illustrated in today’s charts.
To presage his finding, if you will, on October 12th, Cox Automotive Chief Economist Jonathan Smoke opined that, “It could be that October is the bottom for the sales pace, and we start to see gradual improvement – emphasis gradual – in inventory and new-vehicle sales to come.” Hurricane Ida alone should suffice in the “gradual” manifestation department. At the peril of demoting the supply chain disruption, which has undeniably harmed the U.S. auto sector more than any other within industrials, Light Vehicle Production (red line) peaked in July 2020 at an 11.5 million seasonally adjusted annualized (SAAR) rate; it has since slumped to a 7.5-million-unit pace, the lowest since March 2020’s smackdown month.
At the risk of blaspheming, there’s more to see here than a semiconductor shortage.
This is where the reality of outliers steps in. After peaking at an 18.3-million-unit SAAR this past April, the pace of sales has fallen to 12.2 million units (blue line). According to Cox’s estimates, October will mark a sixth consecutive month of declining sales, a 99.4th percentile event. We’ve only the precedents of March and April 2008 and February 2009, three months engulfed by the Great Financial Crisis (GFC).
You may recall the specter of permanent unemployment was a thing back then. We would argue that the same may be occurring right before our eyes today, obfuscated by the sound and fury of reopening and the vestiges of fiscal stimulus spending gone wild. As hinted, we will continue to work on the idea of accelerated automation rendering redundant unknown millions of U.S. jobs since COVID-19 washed ashore as companies fight to mitigate margin damage.
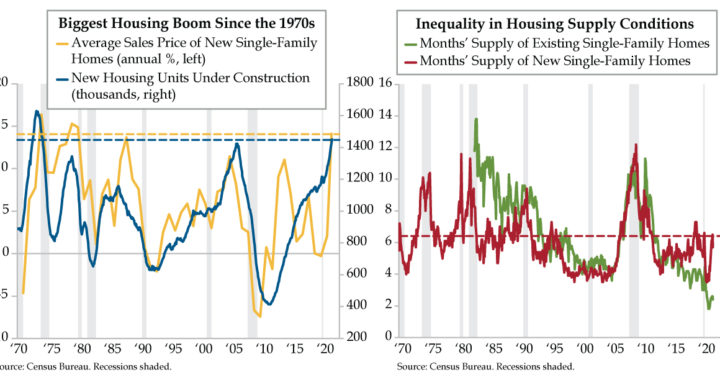
Broadening out, with a hat tip to Simplify’s Michael Green, the number of homes under construction is the highest since 1974. Today’s release of the latest episode of Down the Middle features a deep demographic dive with Zelman Associates’ co-founder Dennis McGill. His exhaustive work, based on years of research married to the most recent Census decennial data, has found that the National Association of Realtors’ estimate of a deficit of 6.8 million homes is too high by a factor of five.
To once again harken the Lacy Hunt rule of cycles, housing and autos lead economies in and out of recession. With more homes under construction than any time in nearly the past half-century, we may be staring down the double barrel of oversupply in both housing and autos at a time of waning demand, to put it politely.
At 0.96, the Inventories-to-Shipment Ratio of Autos within the latest reads on manufacturing we’ve got on hand (yellow line) is the highest since May 2020, when the nation’s automakers were in a whittle-down Defcon 1 mode. That same ratio for non-auto durables (green line) has drifted down to 2.0 from April 2020’s recent high mark of 2.4-times. We add that inventories have been on the rise in the latest prints out of the Empire State and Philly Fed readings.
The urge to stockpile is palpable, and understandably so. “Just in time” is synonymous with “twice burned” in a post-trade-war and post-pandemic world. The risks of being caught off guard with too much inventory on hand have not, however, been diminished if demand destruction as payback for demand pull forward is what we’re witnessing.
Today’s flash Markit PMIs on U.S. manufacturing and services will provide more clues as to where we are in the cycle. We know from Deloitte’s latest survey that holiday spending is anticipated to be up 5% over 2020 this season. This average conceals the fact that higher income earners will do more than their fair share, upping what they shell out by 15%, while those in the lower-income cohort plan to spend 22% less. Absent a big stimulus injection, much of the demand going forward is in the rearview mirror.