VIPs
- U.S. retail sales surprised to the upside in September, seeing a 0.7% MoM gain vs. the -0.2% consensus while July and August saw a combined 0.4% upward revision; in response, equities rallied led by cyclicals, while Treasuries sold off with higher yields in 10s than in 2s
- Real retail sales, excluding food services and deflating with the CPI for commodities, saw volume gains of 0.4% MoM in August and 0.2% in September; thus, price increases drove roughly 60% of August’s headline retail sales increase and 75% of September’s advance
- Little notice was given to the downside in October’s NY Fed Empire State Manufacturing report, which saw new orders, employees, and hours worked all fall; meanwhile, UMich’s Survey of Consumers saw sentiment fall to its second-lowest level since 2011 in October
Great advertising slogans should leave a permanent imprint that immediately conjures the product. “M’m! M’m! Good!” Campbell Soup, of course. “The Breakfast of Champions” should out Wheaties on the brain. “Just Do It” is to Nike as “The Quicker Picker Upper” is to Bounty paper towels. And we all know what America runs on – “Dunkin.” In the 1970s, the tag line “How do you spell relief?” became synonymous “R-O-L-A-I-D-S.” Rolaids, an American brand of calcium and magnesium-based antacid, is produced by Chattem. Invented by American chemist Irvine W. Grote in the late 1920s, manufacturing originated in Chattanooga, Tennessee under one of Chattem’s forerunner companies, which produced the brand for Warner-Lambert, which, in turn, merged with Pfizer in 2000. Ask a Gen X-er the question, and the seven-letter answer will roll off the tongue. Anyone who answers “R-E-L-I-E-F” was born too late to have ever had their brains ingrained.
Investors who were born yesterday – or for the sake of argument, this past Friday – spelled relief with six letters: R-E-T-A-I-L. U.S. retail sales defied the gravity the consensus believed would exert on September spending. The 0.7% month-over-month (MoM) gain significantly surprised the -0.2% Bloomberg consensus and surpassed all but three of the 68 estimates in the survey. When you add in the net 0.4% upward revision to July and August combined, all the new news was the equivalent of a 1.1% print hitting the tape.
This fundamental upside induced a textbook response with equities rallying led by cyclicals, especially the consumer discretionary sector. Treasuries sold off in bear steepening fashion with higher yields in 10s than in 2s. Real yields provided more lift to the 10-year yields vis-à-vis inflation expectations. These moves bolstered optimism for consumer spending, which accounts for a mere 69% of U.S. GDP.
With deference, you’ll have to pardon us for waxing skeptical. It’s time for a check of the R-E-A-L-I-T-Y kind. U.S. retail sales are reported in nominal dollars. These values are the product of the price (P) and quantity (Q) of goods sold in a given month. However, the Census Bureau does not disaggregate the P and the Q. To take out the guess work, one must wrap numbers around the variables to determine if retail’s gains were driven more by inflation than volume.
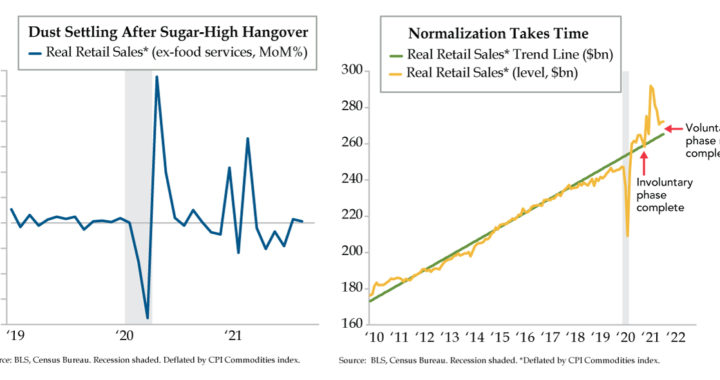
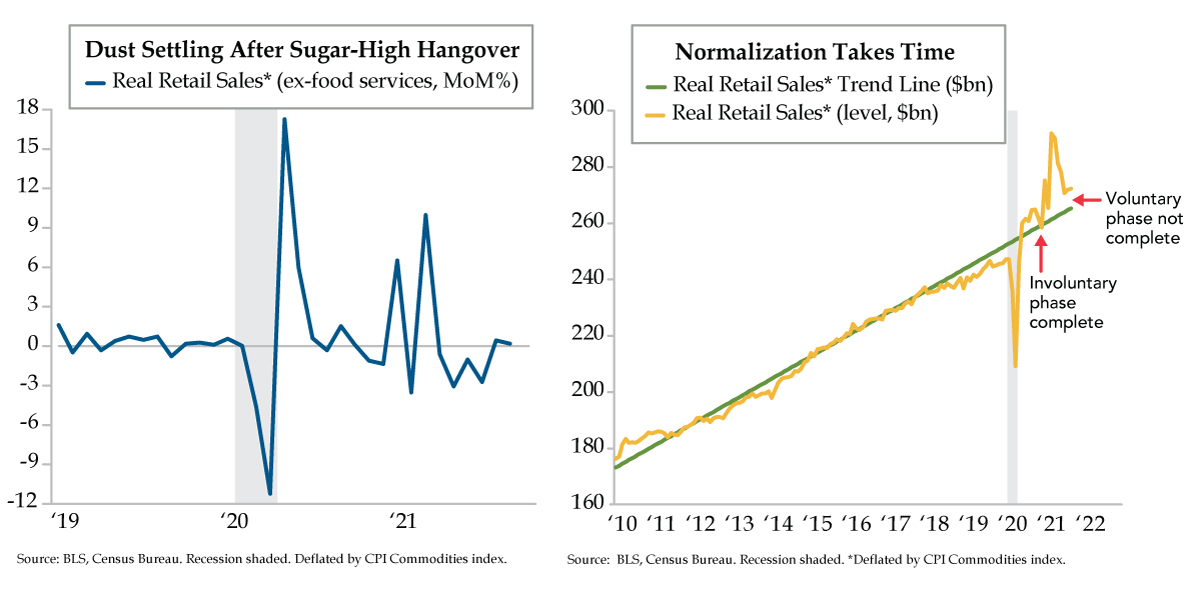
Today’s left chart depicts MoM changes in real retail sales excluding food services & drinking places to get a purer read on goods spending. The CPI for commodities was used to deflate the retail series. Volume gains occurred in both August, at 0.4% MoM, and September, at 0.2% MoM. In both months, however, prices added 0.6% to the dollar value of retail sales ex-restaurants & bars producing nominal gains of 1.0% and 0.8%, respectively. Simply stated, prices accounted for about 60% of the August increase and more than 75% of September’s advance.
Properly contextualizing the inflation-adjusted performance, the last two months of the third quarter (0.6% combined) did little to reverse the four-month losing streak from April to July (7.3% combined). This doesn’t sway us to grab the retail bull by the horns. Moreover, we think there’s still more dust to settle after March’s supercharged, stimulus check spending spree that saw a 10.0% volume gain.
Shifting to the right chart brings a longer-term perspective by illustrating the longer-run path in real (inflation-adjusted) retail sales over the prior expansion, from 2010 to 2019, through the COVID-19 flash recession, and finally, the post-pandemic recovery/expansion (yellow line). The trend line (in green) acts as a “fair value” indicator. Deviations above and below fair value reveal whether retail sales data are “rich” or “cheap,” thus distinguishing the phases of retail sales’ recovery.
The involuntary phase began with last spring’s shutdowns and ended after the subsequent reopening in December 2020 when the yellow line fell back to the green line. The second voluntary phase started after fiscal stimulus was pumped into the household sector in January and again in March, blowing a massive sugar-high spending bubble through the end of 2021’s first quarter. The second-quarter fallback and modest showing to end the third quarter still leave the level of real retail sales 2.7% above trend.
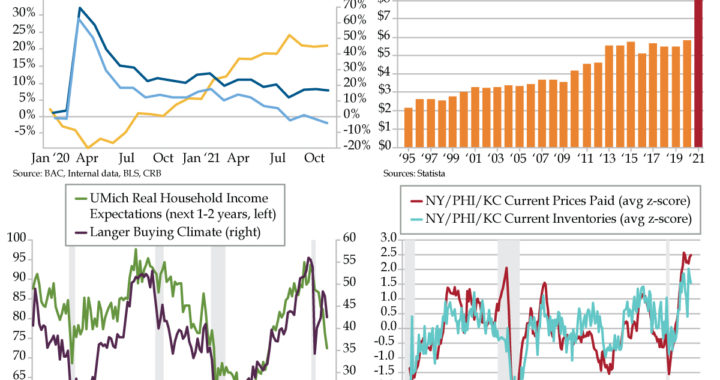
The last chapter of normalization has yet to be written casting doubts on the durability of Friday’s flurry of optimism. Little notice was given to the downside in October’s Empire State manufacturing report. New orders, the number of employees and work hours all fell as did prices received even as prices paid rose and delivery times skipped to a fresh record high. Moreover, the Langer Weekly Consumer Comfort index continued its slide which started just as summer was ending. Most notably, the mood of those who are employed full-time fell for a fourth straight week.
Corroborating the narrative was University of Michigan consumer survey head Richard Curtin, who flagged the Delta variant, supply chain shortages and reduced labor force participation rates in October, all of which sent sentiment to the second-lowest level since 2011 and dimmed the outlook for consumer spending into 2022. Per Curtin: “When asked to describe in their own words why (buying) conditions were unfavorable, net price increases were cited more frequently than any time since inflation peaked at over 10% in 1978-1980.” With consumers expecting to rise 4.8% in the coming 12 months, the highest since 2008, premature bullishness could send, dare we say “irrationally exuberant” investors reaching for those Rolaids.