Birds Anonymous

VIPs

  • Mitch McConnell has agreed to go along with raising the debt ceiling by $480 million, keeping things open through early December; while this gives time for Democrats to raise it again through reconciliation, negotiations between party factions remain a roadblock
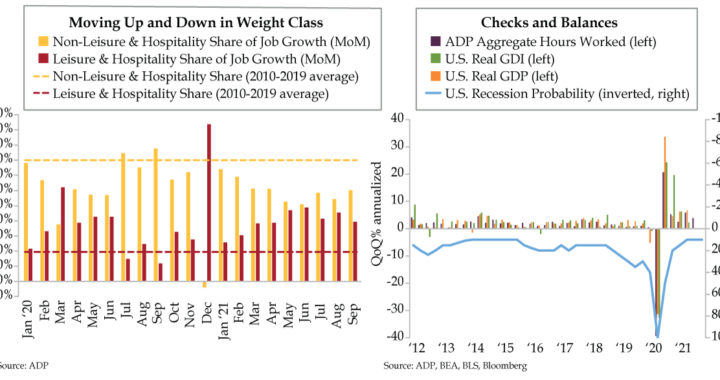
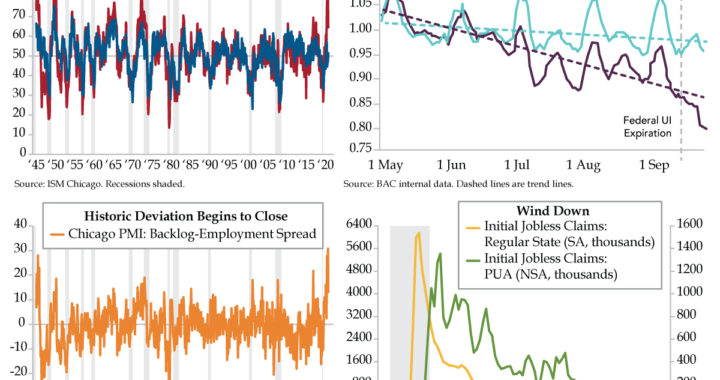
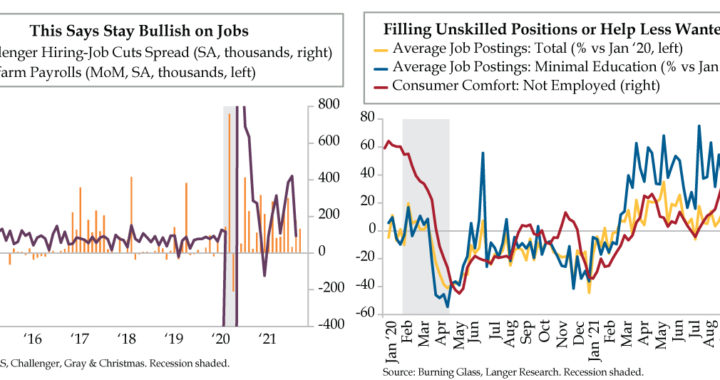
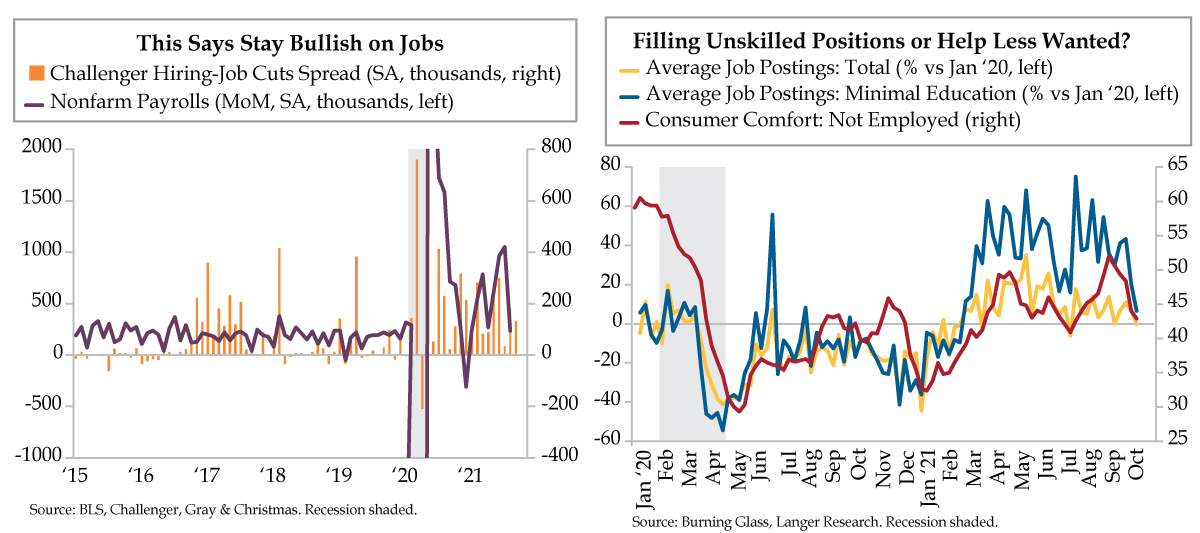
  • Challenger’s Hiring-Layoff announcement spread remains robust, and the series’ correlation with nonfarm payrolls suggests a September gain near the consensus 500,000; however, strength could put added pressure on Powell at his November presser to announce tapering
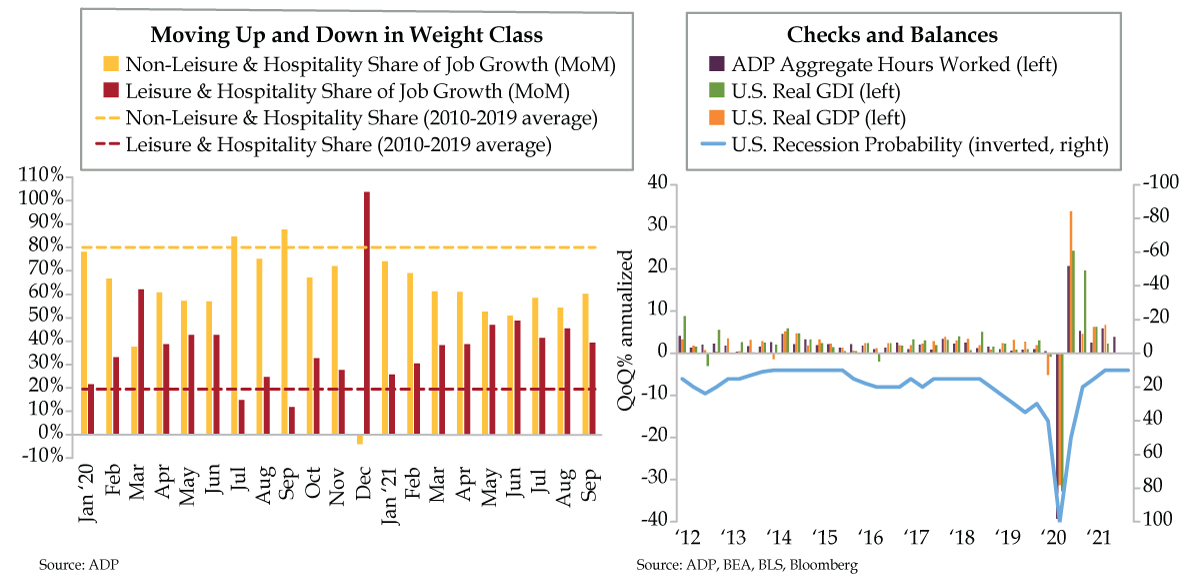
  • Per Burning Glass, nationwide job postings have slipped into negative territory vs. January 2020 levels for the first time in three months; meanwhile, job postings requiring “Minimal Education” are up just 6.5%, the lowest print since February and well off May’s 68.2% peak


“I wouldn’t do that if I were you. If I were you, I’d put him back. It can only lead to self-destruction. It only takes one bird to start you, and before you know it, it’s two birds, then three. Suddenly without realizing it, you’re a victim. Then one day…the end of the road.”

Clarence, Birds Anonymous, Looney Tunes, 1957


The moral: Always think twice before taking that first step into the abyss. While we look back and smile at Sylvester’s being talked back from the ledge, presumably saving Tweety Bird a horrific fate, Clarence’s guidance might have been inspired by a real-world event. On November 16, 1952, the Victoria Advocate ran a story accompanied by a photo of a kitty with a most chagrined look on its face. A random accident – a stray cat locked into a department store overnight – culminated with store officials happening upon the accused feline sitting at the side of what had been a toppled cage that had once housed five canaries, with its spring door sprung open. The only witness to the massacre was a lone canary in an elevated cage.

The phrase, “the cat that ate the canary” has since become a prized purview of political columnists. Though we’ve not yet read today’s recap, an astute Beltway veteran of the press should have ascribed this characterization to one Mitch McConnell in recapping the last few tumultuous weeks on the Hill. While the stock market breathed a huge sigh of relief, shrewd politicos didn’t dare declare victory for one side or the other. For weeks, the Democrats have decried the lack of time to raise the debt ceiling via reconciliation – which only requires 50 Senate votes straight up on party lines. No doubt, this more arduous path requires weeks, if not a month. Still, Senate Majority Leader Schumer was posturing, knowing he’d say and do anything to avoid having his party “own” a $7 trillion increase in the debt ceiling.

And so, with a canary feather barely visibly escaping his lips, McConnell graciously offered $480 billion to keep the U.S. government running through December 3rd and all the time the Democrats need to increase the debt limit between now and then…all by themselves. Will this time resolve the fissures that have opened within the Democratic party? Will a compromised, slimmed down social spending bill’s crafting be assured despite progressives losing their green initiatives and tax hikes to achieve resolution? We ask your indulgence and reply, “Hell no!” But it was time that was “requested,” and time delivered on the part of the GOP. Would McConnell repeat this ruse every two months all the way up to the Midterm elections? With further indulgence, “Hell yes!”

Into this political maelstrom steps one Jerome Powell who went to sleep last night praying for a weak jobs report. Say what you will about his Put being bigger than any of his predecessors. Be that as it may, the chair of the Federal Reserve respects the institution. To uphold its (false) image of being apolitical, the Fed holds tight to the tradition of not making any major policy changes when there’s brinksmanship on steroids in D.C. For good measure, December is a nonstarter as it’s unseemly to change policy with the holidays upon us.

Today’s left chart, however, suggests Powell will be in something of a pickle come November 3rd, when he’s next prompted to the podium for a post-FOMC presser. The last time he was at that same virtual post, he pledged to pull the taper trigger at the November meeting if this morning’s nonfarm (NFP) payrolls did not disappointment. Given Challenger’s hiring announcements are still relatively robust vis-à-vis layoffs (orange line vs purple line), the two series’ historical co-movement suggests monthly payrolls should not leave the consensus, which has coalesced around a neat gain of 500,000, despondent. Bloomberg figures the headline print could come in at half that level and still satisfy the “substantial further progress” criteria.

Zooming in closer to weekly data points for clues, what we should expect regardless of where that top line figure comes in is a welcome increase in the labor force participation rate. Let’s start with the not so chipper set. As you see in the red line, per Langer’s weekly consumer comfort data, the mood amongst those who are not gainfully employed has fallen to the lowest since mid-July. The flip side is in the job postings data. According to Burning Glass, against a benchmark of January 2020, nationwide job postings (yellow line) have slipped into contraction for the first time since this past July.

Before drawing any conclusions about a July pattern forming, the newest news we painted in today’s right graph was in the color of blue. While still up by 6.5%, the last time jobs requiring “Minimal Education” were so infirm was February. To think that in mid-May, these Help Wanted postings (the ones you see around your neighborhoods on handwritten signs) were up a post-pandemic peak of 68.2%.

Those hard-to-fill vacancies appear to be less vacant, and that’s a good thing. If you want validation, focus on this morning’s workweek – that’s where our sights will be set. In the meantime, we’ve got popcorn and a front row seat to what the naïve portray as Kabuki theater in the U.S. capitol. As we’ve long maintained, Minority Leader McConnell is in it to win it.


Spiderman, Princesses and Batman

VIPs

  • Since April 2020, roughly 40% of job gains have come from leisure & hospitality, per ADP, well above the 20% average from 2010-2019; meanwhile, non-leisure has underperformed in the post-pandemic environment, seeing just 60% of job gains vs. 80% in the decade prior
  • ADP’s September payroll report saw a gain of 568,000, well above August’s initially reported 330,000; sectors underperforming headline growth included professional services and trade/transportation while manufacturing, education, and healthcare outperformed
  • Since 2006, ADP Aggregate Hours Worked have had correlations of 0.9 and 0.88 to real GDP growth and real GDI growth, respectively; assuming the workweek is unchanged at 34.7 hours from August, ADP suggests a 4% QoQ annualized rate of expansion in Q3


Halloween’s origins date back to the ancient Celtic festival of Samhain (pronounced sow-in). The Celts, who thrived 2,000 years ago, celebrated their new year on November 1. This day marked the end of summer and harvest and the beginning of the dark, cold winter, which was often associated with human death. Celts believed that on the night before the new year, the boundary between the worlds of the living and the dead became blurred. On the night of October 31, they celebrated Samhain, when it was believed that the ghosts of the dead returned to earth. Over time, Halloween evolved into a day of activities like trick-or-treating, carving jack-o-lanterns, festive gatherings, and especially, donning costumes. According to the National Retail Federation’s Annual 2021 Halloween Spending Survey, 2021’s top three costumes entail more than 1.8 million children dressing as Spiderman, about 1.6 million as their favorite princess, and roughly 1.2 million as Batman.

The act of outfitting economics can require costumes be donned for long calendric periods. At times, entrenched trends can be dislodged for extended periods, measured in months or years. The COVID-19 pandemic shock qualifies as one such disruptor. Eighteen months after landing on U.S. shores, its ripple effects are still evident. Yesterday’s ADP employment report is a case in point.

The leisure & hospitality (L&H) sector was ground zero for the pandemic, which we would add has been a global phenomenon. We know we’re not breaking any new ground here. But for an industry that made up 13% of total private payrolls before the pandemic, a disproportionate 40% of the total job losses at the height of the health crisis in March and April of 2020 were in this area. From that point forward, an average of 40% of the job gains in the post-COVID recovery also came from this heavily consumer-facing part of the labor market (red bars). This was twice the average over the prior economic expansion from 2010 to 2019 (red dashed line). L&H didn’t just get into costume, it’s been punching above its weight class.

For completeness, the contribution to the recovery in private employment by industries outside of L&H stepped down in class over the last 18 months. Non-L&H job growth accounted for six in ten private payroll jobs on average (yellow bars), a notable step down from the eight in ten (yellow dashed line) that prevailed over the prior decade.

To put the labor cycle into perspective, we also use a simple calculation that projects the current month’s gain in ADP forward until the level of employment reaches full recovery. August’s initially reported 330,000 advance projected January 2023 as the month when the hole from COVID would completely be filled. September’s 568,000 gain shortened that timeframe to July 2022.

Let’s go granular. Taking this analysis down one level to the major sectors, L&H is the only one consistent with the headline number. Outperformers, or industries that would recover sooner, include construction, financial, natural resources, education, manufacturing and health care. Underperformers, or industries that would recover later, include “other” services, professional & business services, trade/transportation/utilities and information.

ADP’s claim to fame is as a guide for the granddaddy of all economic indicators — nonfarm payrolls (NFP). The ADP report allows for a recalculation by some forecasters two days before NFP hits the tape. As of this writing, the median of those restating their payroll calls was 550,000. This whisper number compares to the 488,000 consensus from all other economists who didn’t hit the rewrite button yesterday.

ADP also can be used as part of a checks and balances exercise for the near-term economic outlook. To clarify a point made in our prior missive, the slowdown narrative mentioned was not meant to generate a recession scare, the likes of which would bring out the Street’s Chicken Littles. It was done to call attention to the potential misalignment of consensus expectations and the surprise factor that could unfold when chasing forecasts down becomes more visible.

The coming downshift in U.S. growth can be confirmed – or denied – by observing the path of aggregate hours worked in monthly payrolls data. This labor input, which is the number of jobs times the average workweek for the private sector, is a well-regarded leading indicator. ADP’s early release can proxy the official data.

The sky is not falling. As illustrated in the purple bars and assuming the workweek is unchanged at 34.7 hours, ADP suggests a 4% quarter-over-quarter annualized rate of expansion in the third quarter. Since 2006, the ADP figure has a .90 correlation to real GDP growth (orange bars) and a .88 correlation to real GDI (gross domestic income, green bars) growth, the latter of which is a check against headline GDP.

We would add that at a purely intuitive level, something would be deeply amiss if we had not seen a pop in ADP job gains in the month supplemental jobless benefits programs expired. We already know consumption is falling among those who have not taken vacancies. We don’t think the U.S. economy is at the beginning of a dark, cold winter. However, the priced-to-perfection cycle low recession probability at 10% (inverted blue line) is likely at risk once the slowdown narrative is completely digested.

Budget Busters

VIPs

  • Over the last week, IHS Markit has lowered its Q3 GDP estimate (as has the Atlanta Fed), from 3.6% to 1.5%, a far cry from Bloomberg’s 5.0%; driving the downgrade is a stall in private demand, which is working against increasing government spending and inventories
  • In both the manufacturing and services sectors, the Backlog-Employment Spread, per IHS Markit, is at a historically high z-score; although both are likely to continue seeing wage pressures, the issue is most acute in manufacturing, a function of its innate cyclical nature
  • The National Association of Credit Management found more firms expanding their credit lines in September in order to stockpile and address supply chain stability concerns; though higher leverage may be needed to weather higher costs, it also creates added right-tail risks


What has 12 million monthly shoppers, generated savings of more than $8.7 billion and been in business for 21 years? If you said Slickdeals.net, you know your shopping sites. Slickdeals is a social platform for shopping that harnesses the power of crowdsourcing. Every deal is sourced and shared by real people. The Slickdeals online community and team of skilled editors do their level best to uncover great products and layers of savings. In 2019, CNBC picked up a Slickdeals-researched story on rock star household budget busters. It asked 2,000 adults about their budgeting habits and weekly spending. The top 10 budget killers were as follows (percent of respondents): online shopping (40%), grocery shopping (39%), subscription services (37%), technology products (36%), buying lunch everyday (35%), household essentials (32%), coffee (32%), food delivery (32%), gym memberships (30%), entertainment like movies and concerts (29%).

Black Friday has been falling earlier on the calendar for years. This year, vendors have pre-warned shoppers that the wait will be so long it will likely spoil the holidays.  Shopping sites such as Slickdeals will thus attract more clicks in advance. Would-be shoppers are trying to safeguard their budgets. The same cannot be said for businesses across the U.S. economy.

Faced with higher costs beyond their control, many firms have likely burned much of the midnight oil (that’s in short supply) in their financial planning and analysis (FP&A) departments. One anonymous source from a long-standing wholesaler/distributor to a regional supermarket shared with Dr. Gates that his establishment has gone through three rewrites of its budget and not one has yet been approved. This is the first time this has ever happened in the company’s 35-year history. Translation: Hard decisions are coming down the line on the cost side.

Not every corporation is faced with the same circumstances. Some are even resorting to expanding budgets through increased borrowing to compete in the present economic environment. The September National Association of Credit Management’s (NACM) Credit Managers’ Index explained that companies seem to be ordering more than is normal, and thereby requiring additional credit, adding that “although an increase in demand could be the reason, businesses are likely stockpiling materials due to concerns about the stability of supply chains.”

As noted yesterday, it’s taking longer and longer to source said materials. This grabby quality could lead to too much supply against the backdrop of slowing demand. In fact, the experts at IHS Markit hinted at just that in their latest real-time tracking of the U.S. economy. Over the last week, IHS Markit economists (and those, we would add, at the Atlanta Fed), have been taking down their estimate for third-quarter gross domestic product (GDP) from 3.6% on September 30 to 1.5% on October 5. Their latest GDP tracking is a far cry from Bloomberg’s 5.0% consensus forecast.

In short, a stall in private demand has generated IHS’s downgrade. Household spending, business investment and international trade look to have amalgamated to a collective drag on economic activity that could fail to offset the expansion in government spending during the quarter. Inventories is the lone bright spot in the mix, accounting for more than the entire gain in GDP. But this asterisk is no cause for celebration.

When supply drives the GDP bus and final demand shifts into reverse (even if slightly) in a given quarter, it creates a reflex action by Street economists: slash the next quarter’s growth. That’s how you get a slowdown narrative to manifest. Watch for the consensus to start chasing third-quarter growth estimates down, then follow through with cuts to the fourth quarter after the GDP numbers go public on October 28.

We highlight this risk three weeks out because it feeds the outlook for the near-term revenue environment once we get into the third quarter earnings season. While revenues are always beyond a company’s control, wages are a constant operating cost that can be adjusted on the fly, either up or down.

That brings us to the two charts du jour. Both illustrate the same two metrics — one from the view of the manufacturing sector and the other from the perspective of the broader service sector. The two series from the National Association of Credit Management (NACM) depict the demand for new credit and proxy oscillations of movements in the borrowing department. We chose IHS Markit business surveys instead of those from the Institute for Supply Management (ISM) because the coverage is wider by firm size and the access reaches into C-suites. We applied our favorite normalizer – the z-score, or deviation from the mean adjusted for volatility — to level the playing field.

What we discovered was that both manufacturing and service sectors are facing the same issues regarding work piling up and not enough warm bodies to fill positions to get tasks done. The situation is more acute in the industrial sector so these cyclical industries will face more significant wage pressures. But the divergence is similarly substantial implying bigger carrots may need to be dangled to whittle down inboxes.

One way to combat a budget bust is to stare it down and lever up, which the factory sector will eagerly embrace. Service industries’ step down the production chain in wholesaling; transportation and warehousing shouldn’t be too far behind. Higher leverage will be needed to weather higher costs in the most cyclical parts of the economy. Got right tail problems?


Get Ready for This

VIPs

  • Per ISM, September’s 92-day average lead time for production materials was the highest since October 1974; deliveries also slowed after three months of progress, with more than 50% of respondents reporting slower deliveries for just the seventh time since the mid-1970s
  • Crude oil spot prices have seen YoY gains of more than 60% for the last eight months, echoing the run-up to the 2008 financial crisis; should persistence extend to nine months, the comparison to 1974, which saw 12 months north of 60% YoY gains, will be more relevant
  • Bad News Heard: Energy Crisis has barely registered in recent years of UMich’s Survey of Consumers; while Google searches for “energy crisis” in the U.S. were at a 19 out of 100 in October, worldwide interest hit 100, a sign that an energy crisis is underpriced here at home


What do you get when you throw together an airport restaurant cook in an Amsterdam police traffic warden? In the world of pop rock jams, a legend. “Get Ready for This” from the Dutch techno, dance-pop duo 2 Unlimited. Rapper Ray Slijngaard and vocalist Anita Doth didn’t know what hit them in the aftermath of the song’s September 1991 release. Sports fans worldwide react as Pavlov predicted the well-trained would when they hear this call to get on their feet to pump up their teams. “Get Ready for This” peaked in the Top 10 in Australia, Belgium, Canada, Ireland, the Netherlands, Spain, the U.K. and Zimbabwe. The success of the single paved the way for the 1992 album Get Ready to sell three million copies worldwide. The movie and television business also grabbed this intellectual property for such big screen flicks as Space Jam, Flubber and How to Eat Fried Worms and for such small screen shows as Friends, The Big Bang Theory and Brooklyn Nine-Nine.

“Y’all ready for this?” This iconic hook applies to today’s economy. Are we reliving the 1970s? Today’s left chart factors lag into the inflation equation using upstream lead time. Over history, when it’s taken longer to source inputs, the most cyclical part of inflation — durable goods — has run hotter. Conversely, the supply chain’s speeding up created an environment for durable goods deflation from 1995 until COVID-19.

We highlight durable goods pricing because it’s key to determining whether inflation will be transitory. Federal Reserve Chair Jerome Powell singled this out in his Jackson Hole speech (bolding ours): “Booming demand for goods and the strength and speed of the reopening have led to shortages and bottlenecks, leaving the COVID-constrained supply side unable to keep up. The result has been elevated inflation in durable goods—a sector that has experienced an annual inflation rate well below zero over the past quarter century.”

How quickly a different sort of time flies considering Powell’s odds of renomination were closing in on their peak of September 12th’s 92%; as the insider trading scandal has erupted, his odds have fallen to 63% according to PredictIt. But we digress…

September’s 92-day average lead time for production materials was the highest since October 1974 (light blue line), rivaling the episode with the longest lead times in postwar history. Over the 17-month period from June 1973 to October 1974, this buried nugget from the Institute for Supply Management (ISM) manufacturing survey ran at or above the September 2021 level. A year and a half? Sorry folks, that’s not transitory.

The following excerpt from last Friday’s ISM report sheds more light on the supply chain backdrop: It noted that deliveries slowed at a faster rate compared to the previous month, reversing a three-month trend of improvement. Suppliers continued to have difficulties in meeting demand. Five factors were listed including (1) ongoing supplier hiring challenges, (2) extended raw materials lead times at all tiers, (3) increasing levels of input material shortages, (4) stubbornly high prices and (5) inconsistent transportation availability. Rewind a few words. What’s a synonym for “stubborn”? “Persistent.” ISM said it.

Moreover, in September, the percentage of respondents indicating slower supplier delivery times broke above 50% for only the seventh time since the mid-1970s, a 99th percentile event (orange line). Most of these outliers have occurred in a post-pandemic world; we can add the current year’s March, April, May and June to the tally.

Today’s ISM Services report also informs this theme from the broader economy’s vista. The share of participants observing worsening vendor performance has only breached the 50% mark once, during the height of COVID, at 58.3% in April 2020 (green line). Should this metric reach a simple majority again in September, it would be just the second time since the survey’s 1997 inception that breadth was this intense with reference to whole-economy bottlenecks. The difference between 2020 and 2021? Last year was involuntary. This year is not.

History doesn’t repeat itself, but it can rhyme. You can’t make comparisons to the 1970s without incorporating energy prices into the discussion. The Arab oil embargo was the root cause of the 1973-74 oil price shock. Today’s situation is different. But the parallel of persistence would marry the two episodes.

For the entire year of 1974, year-over-year (YoY) gains in spot crude oil prices exceeded 60% for 12 straight months. This duration was duplicated again during the 1979 oil embargo. The current episode has seen the 60% mark exceeded for eight months (including October). An eight-month stretch can be compared more closely to the run-up in oil prices in 2008 during the Great Recession. Should the persistence grow to nine months, then – and only then – can this oil chapter be compared to those of the 1970s.

“Y’all ready for this?” As you see on today’s right chart, U.S. households DO NOT have an energy crisis on their collective radar screens. Bad news heard about an energy crisis barely registered a whisper for years, according to the University of Michigan consumer survey (blue line). Maybe that’s because it’s not trending here. Google Trends U.S. search interest for the term ‘energy crisis’ registered a modest 19 so far in October. Widen the view and worldwide search interest spiked to 100 this month, north of that seen in the Great Recession. Is an energy crisis underpriced here at home? You bet.

To Tuvia

VIPs

  • At a seasonally adjusted annualized rate of $787 billion, residential construction in August hit its highest print since at least 1993; while housing prices rose 23% YoY to a median $342,350 in July, per the Atlanta Fed, median incomes of $67,031 are up just 3% YoY
  • Nonresidential construction has fallen for three consecutive months, from a $460 billion SAAR in May to $456 billion in August; similarly, the Dodge Construction Momentum Index also fell for a third straight month in August as nonresidential demand remains weak
  • Though August’s consumer spending rose 0.8% MoM, this gain was offset by both inflation and the 0.4% downward revision to July’s -0.1% print; meanwhile, the savings rate fell to 9.4% in August from July’s 10.1% as inflation drives the increase in nominal spending


As one Twitter follower, veiled in anonymity as sell-siders must be, sweetly reminisced, “His metaphors and jokes kept me going through 6-7 meetings a day with him. I never wrote them down as I always expected to hear them again on our next trip. I’ll miss him dearly.” Born July 18, 1961, Tobias turned 60 forty-four days before being struck at 6:03 am on September 1st on his way to synagogue. Of the memories shared of his co-workers, which I’m the closest description-wise despite never having worked together at Citi (though he did right before COVID offer to spearhead a Senatorial-run fund), the most repeated characteristic was “self-deprecating.” It was what we did not see in Bloomberg and CNBC snippets that were Tobias’ essence – his deep faith that introduced me to so many kosher haunts in New York I’ve lost count, his extraordinary love and devotion to his family, from wife to children to especially his grandchildren, to his not politically-correct jokes that were somehow still harmless and yes, to his incessant self-deprecation.

It’s difficult to transition to the nuts and bolts of economics and markets as I write this, but Tobias was a consummate and consistent professional producer of stellar analysis and would expect nothing less. With that as shaky preamble, in hard numbers, the highly visible construction sector directly contributes less than 5% of GDP. While not graphed on a quarterly basis in today’s charts, for context, its recent GDP input peaked at 4.7% in 2007 as homebuilders over their skis frantically tried to pull back projects before the bottom fell out. Five years on, the sector had atrophied to 3.4% of GDP and then recovered to 4.3% to end 2020. Since the pandemic hit, however, construction has splintered into the ‘have’ of residential and the ‘have not’ of nonresidential. We’ve touched on this disconnect a few times in the post-February 2020 era and have detected the slightest of shifts in the interim. To preface the latest update, we should remind readers add that the U.S. and global economy were slowing prior to COVID. This is amply reflected in nonresidential’s peak $582 billion contribution seasonally adjusted annualized rate (SAAR) in 2019’s third quarter; it subsequently bottomed at $456 billion in 2020’s final three months and stabilized at $458 billion in this year’s second quarter.

We wish we could report vast improvement on both the housing and non-housing fronts. Alas, it’s still the case that only residential is on fire. August’s print of a $787 billion SAAR is the highest since at least 1993, when Census first started keeping records of the broken-out series (blue line). Backing these nosebleed levels, it’s difficult to see how residential could be weak when, according to the Atlanta Fed — using a three-month average of median home prices from CoreLogic Inc. and the Census’ median household incomes — July median home prices rose to $342,350, up 23% from the year before, vis-à-vis median incomes of $67,031, up 3%. Little wonder those who see it’s a good time to buy a house compared to a year ago has been halved per Fannie Mae data.

Nonresidential remains the counternarrative – it’s fallen sequentially for three months from a $460 billion SAAR rate in May to August’s $456 billion SAAR (red line). While not big monthly moves, neither are they in the desired direction. There is, in so many words, little faith in long-term economic growth prospects in the U.S. even as housing speculation continues to run off the rails. Counting cranes is not the spectator sport it was a few years ago. Punctuating the slowdown, the Dodge Construction Momentum Index, which leads nonresidential by 12 months (yellow line), fell for a third straight month in August. Optimistically, Dodge ventured that, “Demand for nonresidential buildings remains weak, but the recent rising number of new COVID cases should not cause the same amount of disruption as previous waves did.”

We hope Dodge is right. We suspect the bigger factor is the lack of further stimulus. The fact is, U.S. households’ wherewithal to continue driving the economy is what’s relevant above all other factors given consumption fuels two-thirds of the GDP train’s engine. To that end, Friday’s August Personal Income and Spending data might have gone unnoticed given spending ticked up by 0.8%, a big departure from July’s -0.1% reading. But then QI friend Peter Boockvar made the following observation that could not be ignored: “Spending was up by .8% month-over-month, one tenth more than expected but completely offset and then some by the four-tenths downward revision to July. Thus, ALL of the nominal spending increase in July and August was driven by inflation.”

As if not sufficiently daunting, the saving rate delved back into negative territory, to 9.4% versus July’s 10.1%. A bit of perspective – the rate was 19.9% in January and hit a post-pandemic high of 24.8% in May 2020. The best color: the dollar level of savings slipped below its pre-pandemic level after a record 43.2% of U.S. GDP was direct (deposit)-injected into the economy’s veins. We concur with Boockvar’s bottom line that, “higher inflation is eating into income and is about fully explaining the rise in (nominal) spending.” Adjust it all for inflation, as we did in today’s left chart, and there’s not much to be said. For today, as Tuvia would have expected, we’ve also had our say. RIP, my dear, dear friend.

10.1.21-chicago-pmi.jobless

Silky Sweet Breath in the French Quarter

VIPs

  • Though the child tax credit has boosted spending through a $550 monthly boost, BofA credit card data suggests the unemployed cohort is pulling back; though a backlog is likely keeping PUA claims elevated, the cohort has nearly vanished from their May peak of 1.35 million
  • Weekly initial state jobless claims have now risen for three straight weeks, a streak not seen since April 2020; a model from the St. Louis Fed using data from Homebase suggests that hiring could’ve been negative in September, with a seasonally adjusted decline of 810,000
  • Per ISM, the Chicago PMI saw Backlogs decline in September while its Employment Index rose; the Backlog-Employment spread is now down from August’s record high of 30.8 to a five-month low of 13.1, an encouraging sign that the labor shortage is starting to see relief


Can you imagine rubbing horsehair in between your teeth? What a distasteful thought. Thank heavens for Dr. Levi Spear Parmly for liberating our oral health with something much lovelier. In 1815, the New Orleans dentist and author of A Practical Guide to the Management of Teeth invented a thin, waxen silk thread to help his grateful patients clean between their teeth. All of that fresh breath emanating from the French Quarter was a minor sensation, sweeping the country. Commercialization was inevitable. In 1882, the Codman and Shurtleft Company began to manufacture unwaxed silk dental floss. Why a patent was not secured is a mystery. New Jersey-based Johnson & Johnson tended to that task for its own benefit some 16 years on patenting a dental floss made from the same silk materials doctors used to stitch up boo-boos, big and small. The pesky tendency of silk to shred brought about the biggest innovation – nylon, which was conveniently waxed to ease the process.

Today, most of us Glide through this necessary routine to remove plaque from places our toothbrushes can’t Reach, thus preventing the buildup bacteria that wears on your teeth’s enamel and can even end in gum disease, which has to be ickier than horsehair. On the subject of horses…U.S. politicians are once again at a stalemate about the nation’s unhealthy buildup of debt, which financial dentists attest can culminate in the loss of reserve currency status. We wish we could say that nobility or integrity was driving the GOP to insist the Democrats “own” the nearly $7 trillion in debt that’s racked up since July 2019. But the fact is, there’s no lie in claiming that the two parties collectively incurred said debt.

That said, Standard & Poor’s cited the entitlement-debt disease when it downgraded the U.S. sovereign rating a decade ago amidst another debt limit skirmish. Though markets pitched a fit at that surprise, the only thing (largely unfunded) entitlement debt has done since is grow. And the GOP has a point in saying that raising the debt limit for the 79th time since 1960 will glide path passage along strict party lines of a $3.5 trillion social spending bill that, depending on whether it’s the Congressional Budget Office or Office of Management and Budget doing a rudimentary scoring of the bill could cost $5 billion or as much as $5.5 trillion over 10 years. And as every American voter knows, social spending programs, once enacted, never find their way to a grave.

If nothing else, there was some legislating on the Hill Thursday – the government shutdown was averted in the nick of time. Because most of the social spending and hard infrastructure bills are spread out over so many years, the only direct impact passage would have is making permanent cash payments of the child tax credit, which is estimated to have sent $50 billion to U.S. households since mid-July. That one line item in the proposed spending bill is $1.1 trillion. Revelations that Joe Manchin is on board for a much-slimmed down $1.5 trillion package suggest the credit in its current form would not survive.

The good news for consumption is that the average $550 monthly household budget booster via the tax credit is padding the effect of veering over the fiscal cliff. Per proprietary data via Bank of America, “the bad news is that the unemployed cohort is pulling back on spending owing to the expiration of federal unemployment insurance, particularly for the lower income cohort” (upper right chart). Thursday gave us the first glance of what the unemployment insurance ranks will soon be. Presumably, a backlog of claims to be processed is holding up the number of Pandemic Unemployment Assistance applicants (green line) given the program expired three weeks ago. But they’ve nearly vanished in the context of their May weekly peak of 1.35 million.

While state initial unemployment benefits are a pittance of their post-pandemic highs, it is notable that we’ve seen increases for three weeks running, a stretch we’ve not seen since April 2020. According to the St. Louis Fed, something could be amiss in the job market. Using scheduling software company Homebase real-time data, September hiring “could be weak or even negative in September.” Without seasonal adjustment, Homebase’s estimate is a decline of 500,000; the seasonally adjusted decline could be 810,000. While there’s “a lot of uncertainty around these figures,” the model has tracked data “quite well” through the summer.

You would have thought markets would have celebrated the implication that Jerome Powell will be quick to pull any tapering plans if such a print materializes. It’s evident, however, that the dissension within the ranks of the Democratic party preventing a Thursday vote on the bipartisan infrastructure bill and the prospect that the government could run out of money in 17 days, were perceived as a bigger threat to historically highly valued risky assets.

Overlooked in Thursday’s data were declines in the Chicago PMI backlogs (red line) and a rise in its employment index (blue line). The concerted moves pulled down the Backlog-Employment Spread from August’s record high 30.8 to a five-month low of 13.1 last month. It would appear Chi-town firms are finally able to start whittling down their logjammed inboxes by stocking up on staff, a promising sign that the labor shortage is starting to abate. With any luck, next on the docket is addressing the shortage of fiscal prudence inside the Beltway.


Hot Mulled Cider Day Is Upon Us!

VIPs

  • From zero in 2008, the Fed has expanded its holdings of mortgage-backed securities to $2.54 trillion in September 2021; the Fed’s MBS holdings are tethered to housing proxy Sherwin-Williams, which has seen its stock price double since expanded QE began in March 2020
  • The average mortgage loan size for adjustable-rate mortgages totaled $977,400 in September, $661,000 higher than the $316,400 for fixed-rate mortgages; this spread was roughly $200,000 in 2008 before QE began and higher-priced homes saw faster price appreciation
  • As a share of GDP, home improvements have hit record highs of 1.4-1.5% post-pandemic, exceeding the 1.3% not surpassed since the series’ inception in 1959; multi-generational households have become more common as would-be new buyers have been priced out

A week into autumn, it’s time to embrace the (at this point, trite) pumpkin flavor of the season. Aside from being the day the U.S. government could shutter, today is National Hot Mulled Cider Day. The scents of cinnamon, nutmeg and apple incense the olfactory. Toasty mugs of mulled cider around which to wrap our (still warm from the drawn-out summer) hands around promise to snug us up from the inside out. There is, thank heavens, a history here tied to the old pagan ritual of “Wassailing.” ‘Wassail’ derives from the Anglo-Saxon ‘waes hael’, or ‘good health’. The wassail drink was made with mulled ale, curdled cream, roasted apples, eggs, cloves, ginger, nutmeg and sugar. Mulling the cider entails heating it to almost boiling and adding cinnamon, orange peel, nutmeg, cloves, and other spices. If you’re still with us and fancy a food pairing, we suggest a creamy pasta dish, gingerbread, turkey dinners, blue cheese, squash soup, pancakes, cinnamon sugar doughnuts or apple pie. Is your home warmed at the thought? Are your spirits lifted?

Asset holders’ portfolios have never been better lifted since central banks strolled down QE (quantitative easing) Lane more than a decade ago. Moreover, since the Fed’s all-in March 2020 moment, backstopping the credit markets and unleashing unlimited QE, risk assets qualify as understudies in The Untouchables.

One of the innovations of the QE era was the Fed’s balance sheet expansion into the mortgage-backed securities (MBS) market. From no holdings at the end of 2008, this line item has expanded to $2.54 trillion inside the space of 13 years. That’s the latest figure we have on hand as of the latest available week in September 2021 (green shaded areas in both charts). The unprecedented, targeted support for the U.S. housing market, especially over the last 18 months, has supercharged returns for certain securities.

Take Sherwin-Williams. The Cleveland-based global leader in paints and coatings (ticker SHW) that’s beautified the Earth for more than 150 years has seen its share price rise nearly 15 times since 2008. From the COVID-19 abyss in March 2020 to present day, you would have doubled your money. A glance at the left chart reveals the slope of SHW over the last year and a half (blue line) which was effectively painted by the Fed’s expanded support of MBS. It’s almost too obvious that the Fed put was the driver.

Why focus on a paint company? It’s a leading indicator of a leading cyclical sector. More paint is demanded when home sales are on the rise. Before they sell, homeowners touch up here and there. Some even throw a neutral color onto the walls over something bolder at the advice of their overpaid realtors.

Not coincidentally, the run up in home selling conditions to August’s record high ran parallel to SHW’s share price breaching the $300 level for the first time. For what it’s worth, the near 7% correction in Sherwin-Williams in September happened alongside the sharp 10-point drop in home selling conditions this month, a 93rd percentile event.

Paint is also a vital component of any home improvement project. Update a kitchen or a bathroom or finish a basement and you’re bound to be sampling different colors on the walls like so much artistic spaghetti. Ever the innovator, Sherwin-Williams allows renovators to order 2” x 3” color chips and/or 8” x 8” peel & stick samples to see how colors will look in the new space. How very accommodating.

Big-ticket projects are typically completed by high rent district residents. Like the longs in SHW, the Fed has had their backs too. The right chart depicts one angle into the relatively faster home price appreciation for high-brow homes. The red line illustrates the widening spread between the average mortgage loan size for ARMs (adjustable-rate mortgages) and FRMs (fixed-rate mortgages). Through September, the level of the former averaged $977,400, while the latter clocked in at $316,400, producing a $661,000 gap. That same spread just prior to QE’s 2008 kickoff was slightly under the $200,000 mark.

The upshot which scrolled across the Bloomberg terminal yesterday: Per the American Enterprise Institute, the share of FHA-backed mortgages to buy a home, which proxies homes purchased by younger and lower-income entry-level buyers, slumped to 18% this past June from 23% in March 2020, before the pandemic swept the country, and the Fed launched its ‘k’-shaped recovery campaign. That marked the lowest level since at least 2012.

One of the outgrowths of being priced out of the market is the explosion in multiple generations living under one roof. Ergo, as a share of the U.S. economy, home improvements have never been bigger. Post-pandemic, this subset of residential investment advanced to record highs in the 1.4%-1.5% range (purple line). The dashed line designates the 1.3% threshold, a level that had never been surpassed since the series’ 1959 inception. Not coincidentally, the Fed’s MBS expansion occurred in tandem to this “achievement.”

The Fed’s level of housing support is unlikely to shift into reverse anytime soon. Even if the taper of asset purchases winds down by the end of 2022’s first half, reinvest of principal payments from MBS will maintain the level of its holdings. When – and if – MBS QT (quantitative tightening) is announced, the fundamental support will change. Until then, grab yourself a mug full of hot mulled cider and toast to a continued expansion in the home improvement sector.

Greetings from Timbuk3

VIPs

  • QI’s Future Inventories proxy, a composite of regional Fed surveys, at 14.2 in September, was nearly 10-times last decade’s average of 1.4; however, their correlation with ISM Mfg New Orders appears to have broken, with readings diverging over the last seven months
  • At 86.6 in September, Conference Board’s Consumer Expectations Index rivals the depths of the COVID recession, with a read of 0.0 as a z-score; after seeing a full recovery to 111.9 in March vs. February 2020’s 108.1 print, consumers are curtailing spending for large durables
  • 12-month inflation expectations have printed north of 6% every month this year, with the latest readings north of 2 as z-scores; though these expectations have trended with oil prices in the past, WTI’s recent spike to $75 has not been the driver of consumer pessimism


I study nuclear science
I love my classes
I got a crazy teacher
He wears dark glasses
Things are going great, and they’re only getting better
I’m doing alright, getting good grades
The future’s so bright, I gotta wear shades
I gotta wear shades


“The Future’s So Bright, I Gotta Wear Shades” was the only mainstream hit by folk rock band Timbuk 3 and opened their debut album, Greetings from Timbuk3. Released in 1986, it climbed as high as #19 on Billboard’s Hot 100 chart. Band founder Pat MacDonald revealed on VH1’s 100 Greatest One-Hit Wonders of the 80s that the meaning of the song was widely misinterpreted as a positive perspective about the near future. On the contrary, it was a grim outlook. While not saying so directly, MacDonald hinted at the idea that the bright future was in fact due to an impending nuclear holocaust. It was a song, born during the last years of the cold war, among a smattering of predictions transcending several cultures which had foreshadowed the world ending in the 1980s.

Since you’re reading this, you’re aware those prophecies never came to pass. At last check, it is 2021. As for a bright future, it’s on display in our future inventories proxy. This forward guide for “it-girl” metric ISM manufacturing New Orders is a composite of manufacturing, services and retail future inventories indices from business surveys reported by the Federal Reserve Banks of Dallas, Kansas City, New York, Philadelphia and Richmond. Recall, the rule of thumb: “If you want to build future supply, order more today.”

How bright was September’s reading? The 14.2 figure was nearly 10 times greater than the last decade’s average of 1.4. The seven-month double digit streak culminating in September is unmatched over any span in the last 20 years. Moreover, after applying our favorite normalizer, every month in the period from March to September exceeded a 2 z-score (deviation from the mean adjusted for volatility, yellow line).

Full disclosure: We’ve used the future inventories proxy consistently as a near-term gauge for cyclical momentum in the U.S. economy. The past relationship between it and ISM New Orders provided confidence to make high conviction calls about future fundamentals. The divergence in the last seven months implies a breakdown in the connection between the two figures. A simple one-factor regression predicted ISM readings in the 70s; actual numbers were in the 60s (and z-scores were in the 1s, blue line).

A look back over history in the right chart shows that future inventories is the ‘yin’ to ISM orders ‘yang’. But not in 2021. The decoupling can be explained by the supply chain’s inability to meet demand. The persistence of future supply outperformance over current new orders means not all orders are being fulfilled. We wouldn’t go so far to call this a grim outlook like Timbuk3’s MacDonald. Instead, it’s the oxymoronic, “disappointing right-tail” problem that manifests in higher cost inflation across production and distribution channels.

Another leading indicator that’s become disconnected from the past ebb and flow of the two cyclical guides is illustrated in yellow and blue above. Since 2019, consumer expectations (red line) became unglued from the past path that tracked relatively closely to future inventories and ISM orders. Two years ago, the former was bolstered by income expectations driven by a late-cycle money grab via good unemployment (i.e., job leavers/quits), while the latter two were faced with buffeted by the trade war.

As multiple contemporary gauges corroborate, current household optimism for an economic recovery has faded. The all-clear surge in consumer expectations pushed the index to 111.9 in March, a full recovery from February 2020’s pre-pandemic level of 108.1. This month’s 86.6 print rivals the depths of the COVID recession; its z-score registered an incontrovertible 0.0. Consumers must have grown accustomed to the consistency of the stimulus checks being direct-deposited every few months.

The Conference Board noted that the “declines suggest consumers have grown more cautious and are likely to curtail spending going forward.” Households have flagged a full-on retreat in spending intentions for autos, homes and major appliances. In fact, six-month forward plans to buy a new vehicle and/or home both neared record lows in September. Sticker shock has clearly set in signaling a buyers’ strike.

The Conference Board’s tally of inflation expectations also scores points for Team Persistent. Since the calendar turned in January, 12-month forward inflation expectations have printed north of 6% in every month building in higher lows and higher highs. Translating to z-scores, the latest are running in the +2 neighborhood (purple line).

Over time, Conference Board inflation expectations and oil prices have closely co-trended. Dare we venture yet another ‘however,’ the recent run-up in West Texas Intermediate to the $75 zone translates to just a 0.5 on the z-score scale (orange line). This implication: consumers aren’t complaining about oil in the context of their collective forward view on prices. Something else is amiss.

This is where we should add that consumers perceive their future as none too bright when it comes to the key spending gauge of income expectations that’s retreated for three months running. Rising pessimism for future employment conditions, which are nearly 16 points south of their June apex, (“Fewer Jobs”) and a bottoming in the unemployment proxy “Jobs Hard to Get” also cast a late cycle glare that doesn’t require shades to shield. Double dip, anyone?

Conventionally Wise

VIPs

  • Single-family home builder confidence inched up in September, per the National Association of Home Builders, on lower lumber prices and strong housing demand; despite the optimism, the housing sector continues to face supply chain issues and labor challenges
  • Buying conditions posted a -3.24 z-score in September, well south of corresponding readings for interest rates, at -0.44, and economic uncertainty, at -0.73; despite sky-high selling conditions, the housing cycle appears to be rolling over, in light of stiff headwinds to demand
  • Purchase volumes tracked by the Mortgage Bankers Association and Optimal Blue are now back in sync for the first time since the pandemic began; with both series seeing double-digit YoY drops, the Bloomberg consensus that housing starts stay flat appears overly optimistic


Merriam-Webster defines conventional wisdom as the “generally accepted belief, opinion, judgment or prediction about a particular matter.” For instance, conventional wisdom in Hollywood says that a movie can’t succeed unless it stars a famous actor or actress. The term dates back to 1838, but more often than not, it’s credited to the economist John Kenneth Galbraith, who used it in his 1958 book The Affluent Society. Galbraith wrote: “It will be convenient to have a name for the ideas which are esteemed at any time for their acceptability, and it should be a term that emphasizes this predictability. I shall refer to these ideas henceforth as the conventional wisdom.” The two-word phrase was used throughout the text to explain the high degree of resistance in academic economics to new ideas (imagine that!).

In the current economic environment, the narrative of a tight supply chain and labor market generate the mantra that supply limits demand. It’s understood that varying capacity constraints create a natural headwind to expansion. Call this the conventional wisdom of the day.

Let’s apply this to the housing sector. On Monday, the National Association of Home Builders explained that single-family home builder confidence inched up in September on lower lumber prices and strong housing demand, even as the housing sector continues to grapple with building material supply chain issues and labor challenges. Lumber prices, construction material costs and construction worker wages are easily illustrated – and have been closely watched concerns on the cost front. Strong housing demand, so the rote thinking went, was assumed.

Before digging deeper, buying a home is the largest financial commitment the average U.S. household makes. Acquiring the keys and crossing the threshold means buyers finance home purchases with residential mortgages. There are three pillars to such financed purchases: 1) prices, 2) interest rates and 3) unemployment.

Price determines the capacity to commit — there’s an inherent affordability quotient involved in a high versus low price backdrop. The former whittles buyers out of the equation; the latter fills the potential buyer pool. Because a large majority of homes have a six-digit price tag and most buyers finance, interest rates allow the interested parties to pay over a longer period of time to meet the monthly budget.

Ergo, in the ultimate analysis, unemployment dictates when the housing cycle begins and ends. To articulate the obvious, a falling trend in joblessness breeds lender optimism, while a rising path creates pessimism. Unemployment is akin to creditworthiness, and bankers slide up and down the tightening/easing scale depending on where the economic cycle is residing.

Where are we now? The price pillar has collapsed. The white hot buying conditions advanced lightning fast from reticence to successively higher highs in in 2021. The September level (purple line) printed at a -3.24 z-score (deviation from the mean adjusted for volatility), well south of that of the corresponding readings for interest rates (-0.44, orange line) and economic uncertainty (-0.73, light blue line), the proxy for unemployment.

The biggest refutation to the narrative is home selling conditions, an alternative guide to housing demand. We can’t deny that home selling conditions related to prices hit an all-time high in August. Home sellers prefer to sell in a rising market – and this market supremely qualified. But the pool of home sellers is smaller than the pool of home buyers. Homeownership rates in the U.S. are not 100%, they are closer to 65%. So, home selling conditions can never provide the whole picture.

Most owned dwellings in America are purchased by middle-income and upper-income households. We approximate about 85% of home sales are made by these two cohorts (using Bureau of Labor Statistics’ Consumer Expenditure Survey data). Since this represents the lion’s share of purchases, understanding how these buyers feel about prices in the current environment is instructive for judging niggling challenge to demand. In sum, they’ve never been more pessimistic.

The right chart depicts an aggregate indicator of middle-/upper-income home buying conditions related to prices. The plunge is historic. The gravity of the situation also suggests demand is facing stiff headwinds. If anything, the gut reaction by these buyers is postpone the purchase until prices move to your favor. Anyone have an answer when that will be?

One corroborating signal for demand is coming from mortgage application activity. Home purchase volume tracked by the Mortgage Bankers Association and from Optimal Blue are back in sync over the last six months for the first time since before COVID hit. According to the American Enterprise Institute Housing Center, both series are “the best indication of lending reality going forward”, and both are posting double-digit year-over-year declines.

Conventional wisdom from Bloomberg’s consensus estimates for housing starts project a relatively flat profile over the next four quarters. This would imply a steady revenue path over the next year for home builders. In our view, this seems somewhat overly optimistic given the unprecedented developments regarding home buying conditions that have unfolded for the biggest buyers of homes in America.

As if we needed more corroboration, QI amiga Phillipa Dunne parsed Zillow data concluding that sales were slowing, inventory was rising and more price concessions were prevalent, adding that “returning to earth from the stratosphere is likely to be a shock in some type of way, as the Zoomer kids say. From this Zillow data, it looks like reentry has begun.” We humbly concur.

Transitory, Persistent or a Third Option?

VIPs

  • The YoY trend in personal income, less taxes and transfers, has seen its forward momentum stall in recent months, per BEA data; at the same time, credit card borrowing has ramped up significantly, posting the first gains on a YoY basis since the pandemic began last March
  • At 1.6%, 12-month Household Income Expectations, per the University of Michigan’s Consumer Survey, have not yet returned to pre-COVID levels north of 2%; with current CPI at 5.3% YoY and short-run expectations at 4.7%, the hit to purchasing power is notable
  • After hitting a record high 11% in June, those expecting incomes to rise by more than 25% fell to 7% in September, in line with the long-run average; a decrease in short-term job leavers, from 40.9% of the unemployed in May to 34.1% in August, confirms the trend


The joy of parenting doesn’t come with a handbook. But certain rules of thumb that may get passed down by the generations can become good advice to follow. For example, take the idea of choice. For the rug rats in your life, psychologists recommend giving your children only two choices at a time when they want to make decisions. Kids want and expect their parents to provide structure and make key family decisions. It helps them feel safe. While it’s great to give kids a say in things, too many choices can overwhelm them or put too much pressure on them.

When reacting to inflation, it feels like the Fed has conditioned financial markets to think in two ways. It has done this by taking one side of the argument – the Fed believes inflation will be transitory. Therefore, the other side of the argument is the opposing view, inflation will be persistent.

Last Friday’s University of Michigan (UMich) consumer survey dug into households’ potential reactions to inflation. The first one was in the context of a transitory rise. In this case, consumers were seen postponing purchases and slowing spending in the months ahead. Once the temporary period of higher prices ended, consumers would resume spending at a quicker pace and a rebound would ensue.

The second reaction put inflation persistence under the umbrella of a significant fiscal and monetary expansion. Inflation psychology would develop, and greater demands for wage increases would be part of the outcome. To judge this version, however, would take time because long-term inflation expectations would have to become unhinged, not the case in the UMich survey.

UMich survey director Richard Curtin didn’t stop the discussion there. He illustrated a third option (bolding ours):

  • “The final alternative is that consumers may believe that the most effective strategy to maintaining their purchasing power is to emphasize increases in their incomes, net of taxes and transfers. The effectiveness of pandemic transfers were shown to be successful in offsetting hardships among those most vulnerable to economic disparities. Transfers to offset the inflationary erosion of living standards would be justified in a similar manner.”

The third reaction has an agnostic quality regarding the transitory vs. persistent dispute by focusing on purchasing power instead. This puts the onus on consumers to find a way to more than offset the headwind from higher prices. That can be done by increasing income, cutting household budget costs or a combination of the two.

Before exploring that, we illustrated personal income excluding taxes and transfers. What we discovered was that the year-over-year (YoY) trend has stalled in recent months (blue line). Forward momentum has essentially stopped. In its place, credit card usage has ramped up significantly (red line), posting the first post-COVID gains on an annual basis since the pandemic first hit.

Optimists would opine that the recovery in income expectations has made households more comfortable using plastic to borrow tomorrow’s income today. Pragmatists would respond that there has been progress on the income expectations front, but not substantial.

Median income expectations from the UMich survey have not returned to pre-COVID levels north of 2% despite recovering from last year’s involuntary shutdown abyss by the fall of 2020. The current 1.6% tally implies a stagnation of sorts. Since April 2021, household income expectations over the next twelve months have traveled in a tight range (1.6% to 1.9%). The hit to purchasing power is decidedly large when you factor in current inflation (consumer price index at 5.3%) or even short-run household inflation expectations (UMich one-year figure at 4.7%).

The UMich survey also illustrates how consumers can emphasize increases in their incomes. Twelve-month forward income expectations are broken down into a number of buckets: 1-2%, 3-4%, 5%, 6-9% 10-24% and 25% or more. To best offset the squeeze from prices, more consumers would look for ways to generate the biggest boost to their future income. That happens when the 25%-plus bucket swells significantly. That’s usually when more consumers opt to jump ship for better paying opportunities, much better paying. Job leavers or voluntary quits surge.

Unfortunately, this dynamic peaked in the spring and has faded through the summer months (orange line). Consumers expecting to earn 25% or more in the next year matched a record high 11% in June. By September, this guide fell to 7%, in line with the long-run average. The move away from the right tail can be confirmed by a fall back in “good unemployment.” This oxymoron defined as very short-term job leavers surged from 29.4% of the unemployed in January to 40.9% in May (purple line). It has since fallen back to 34.1% in August.

The third option of bolstering purchasing power no longer has the wind at its back from a money grab perspective. It would take another surge in workers deciding to test the waters for better pay in order to help offset the most bearish price developments in decades for buying conditions for autos, homes and home goods. Without true gains in purchasing power through the income channel, stagflation risk would continue to fester. This is a key test of the sustainability of the rebound in consumer spending.