VIP
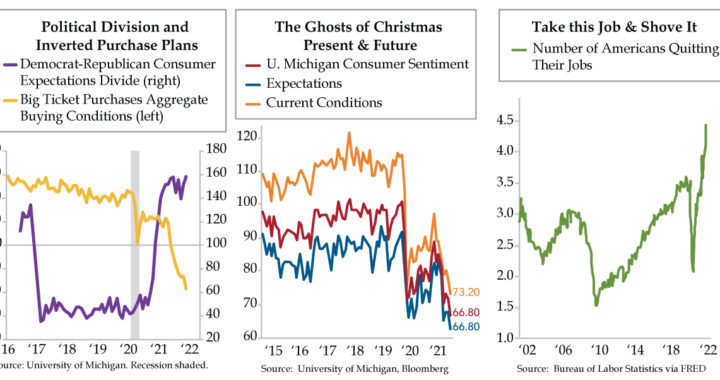
- The record 4.3 million U.S. workers who quit in September total 3.0% of total employment, a sign of increasing worker confidence; geographically, quits were highest in the South at 3.3%, and were outsized in food/accommodation and arts/entertainment at 6.6% and 5.7%
- Though off a record high 7%, job openings still remain at an extraordinarily high 6.6% of total employment; however, per UMich’s most recent survey, Current Conditions slumped to 73.2, an August 2011 low, while Expectations slid further to 66.8, an October 2013 low
- Buying conditions for household goods slipped to a 78 in UMich’s latest read, the lowest since 1978; and despite a record number of quits, one in four households anticipate being worse off in 12 months and the Democrat-Republican expectations divide hit a new high
“Ask no questions, and you’ll be told no lies.”
Charles Dickens
Great Expectations
The last thing you want to read in a Feather top is trite. With that as preamble, I used the quote above from Charles Dickens’ Great Expectations. It better resonated after listening to Janet Yellen and other Federal Reserve officials make their way through the Sunday Big Four TV circuit being asked softball questions, giving softball answers. The truth is, with apologies, trite is the only thing I can’t get out of my head as I take in today’s charts. Indulge me. I quote in its entirety what follows, “…the worst of times.” Dickens’ fullness best captures today’s U.S. economy: “It was the best of times, it was the worst of times, it was the age of wisdom, it was the age of foolishness, it was the epoch of belief, it was the epoch of incredulity, it was the season of Light, it was the season of Darkness, it was the spring of hope, it was the winter of despair.”
Let’s start with the best of times for the record 4.3 million U.S. workers who quit in September (green line). This headline has been everywhere since Friday morning as proof of the strength and endurance of the economic recovery. There’s no doubt a 3.0% of total employment Quits rate –Yellen’s proclaimed favorite labor market barometer – at unprecedented heights speaks volumes to the unbridled job security and power over their employers’ workers in desired fields have.
The details of the Quits data are even more remarkable, which is obfuscated by the monthly delta of the 0.1% increase in the Quits rate to 3.0% between August and September. No labor economist in the industry bests QI friend Philippa Dunne when it comes to the weeds of data on employment in America. Here are the details in full that she pulled from the Quits data alone, which are key to appreciating the massive increases in certain industries and surprising declines in manufacturing, both of which I will bold:
“The Quits rate slipped in the northeast, to 2.2%, and in the Midwest, -0.2 percentage points (pps) to 3.0%, but rose a tick in the South, 3.3%, and jumped in the West, up 0.4pps to 3.1%. Sectoral detail was mixed, with quits in construction and logging & mining down 0.1pps, to 2.5% and 1.5%, durable manufacturing unchanged, but nondurables up 0.5pps to 3.5%. Quit rates in education were up, 0.5pps to 1.7% in the private sector, and 0.4pps to 1.1% at the state and local level. Other services saw a big jump from 2.3 to 3.1%, where there were unusually large gains in employment in October, led by laundry services. After rising a full point to 6.6% in August, the quit rate held steady among food & accommodations workers but jumped from 3.2 to 5.7% among those working in arts & entertainment.Rates in wholesale trade, -0.6pps to 2.2%, and in retail trade, -0.4pps to 4.4%, fell, but rose in transportation and warehousing.”
I can vouch for the laundry services and arts and entertainment spikes. My most recent New York hotel stay included daily cleaning, all the way down to the fresh sheets daily. That uptick in services is impossible without the laundry industry getting JOLT-ed. Ditto for the two last viewings of Daniel Craig’s last Bond movie (tragedy for womankind) – the movie theater audiences in both instances have been full and the counters sending overpriced popcorn fully staffed.
We add that after peaking at 7.0% of total employment, job openings have slid to a still extraordinarily high 6.6%; the declines were led by the South and the West. Why niggle with such details when we’re contemplating an openings number north of 10 million? Take in that middle chart – we’ve grown accustomed to Expectations (blue line), tracked twice monthly, by the University of Michigan (UMich), leading the way down. What stood out in Friday’s report was Current Conditions (orange line), which played serious catch-up to Expectations and has slumped to an August 2011 low (debt ceiling showdown, anyone), and blew past (in a bad way) what consumers expect, which collapsed to an October 2013 low.
But hadn’t we concluded that it was the best of times? Some 4.3 million Americans quit their jobs in September, for God’s sake. The devil is in the details for those without employee empowerment. Or, as half-century UMich economics guru Richard Curtin rightly observed, sentiment is at a decade low due to, “escalating inflation and a growing belief among consumers that no effective policies have been developed to reduce the damage from surging inflation.”
What we are witnessing IS the best and worst of times. We’re taking in, in real time, this inequality divide writ large.
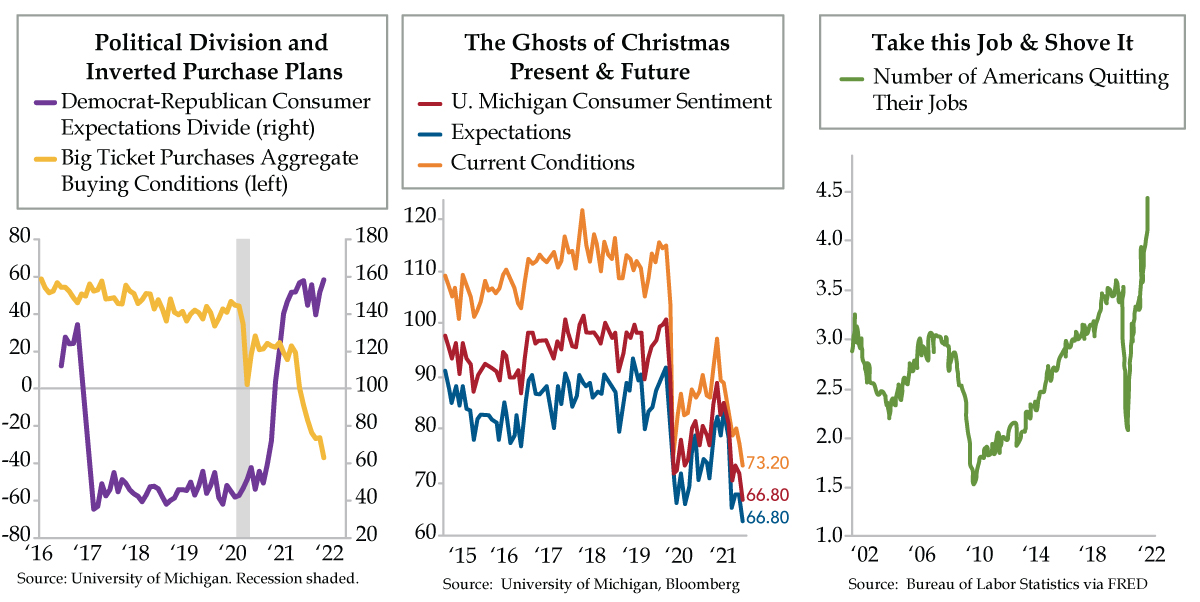
The UMich report showed buying conditions for household goods deteriorated sharply, with a gauge falling to a reading of 78, the second lowest in data back to 1978. At QI, we disdain the superficial, so Dr. Gates dug deeper and aggregated buying conditions across the three majors – homes, cars and durables (yellow line). At 63, the record low is, and remains, unprecedented. One in four households anticipate being worse off in the coming 12 months, the antithesis of the record number of Americans quitting their jobs. For good measure, the U.S. has never been this divided as a country (purple line). We despise one another, which makes it the worst of times indeed.


