VIPs
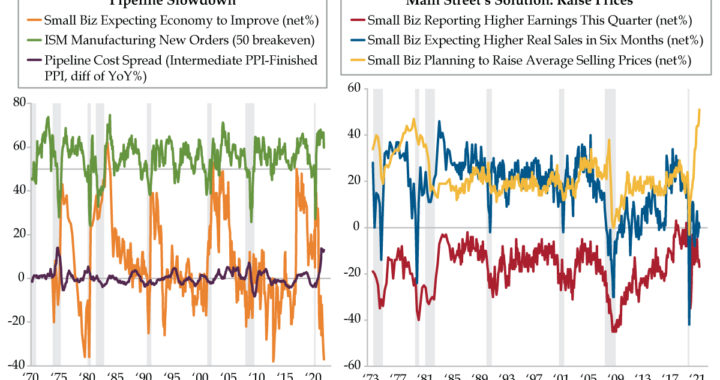
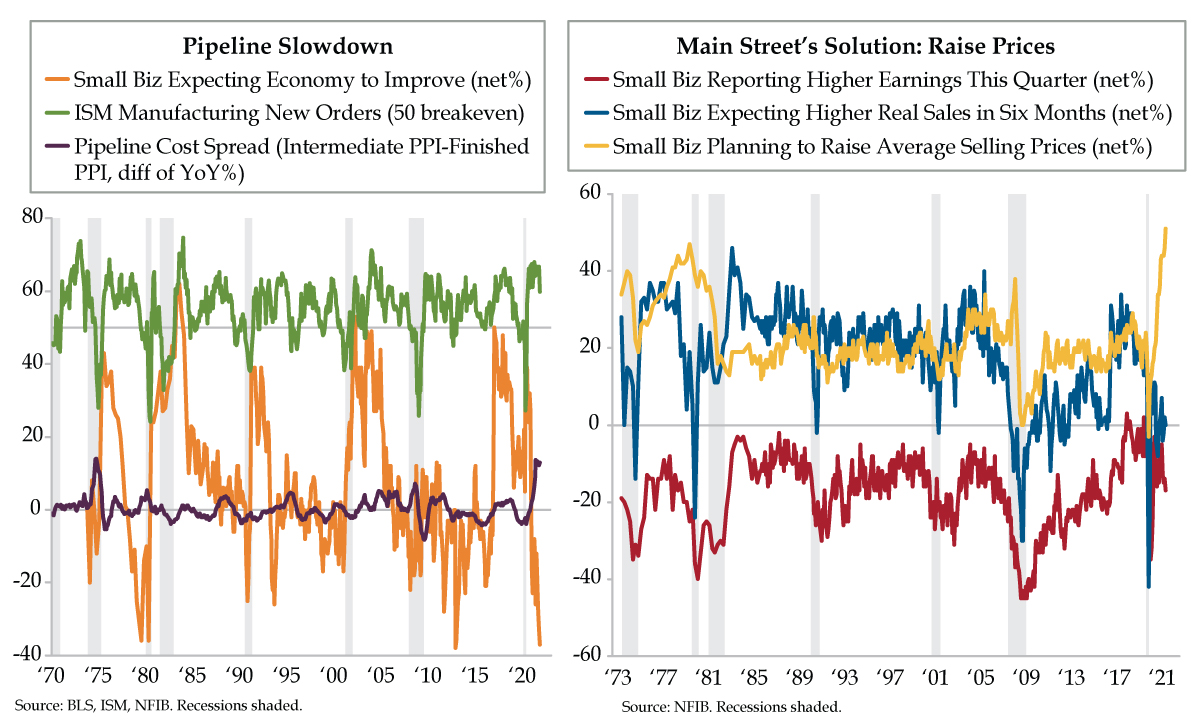
- PPI inflation for intermediate goods has exceeded the same metric for finished goods by a double-digit margin for the last six months; only the seven-month stretch from July 1974 to January 1975 compares historically, as pipeline pressures risk bleeding into consumer prices
- ISM Manufacturing New Orders, though still above the 50-breakeven, has fallen below 60 after a 15-month streak north of that threshold; further declines could continue to push down Small Business Expectations, already at near record pessimism due to elevated uncertainty
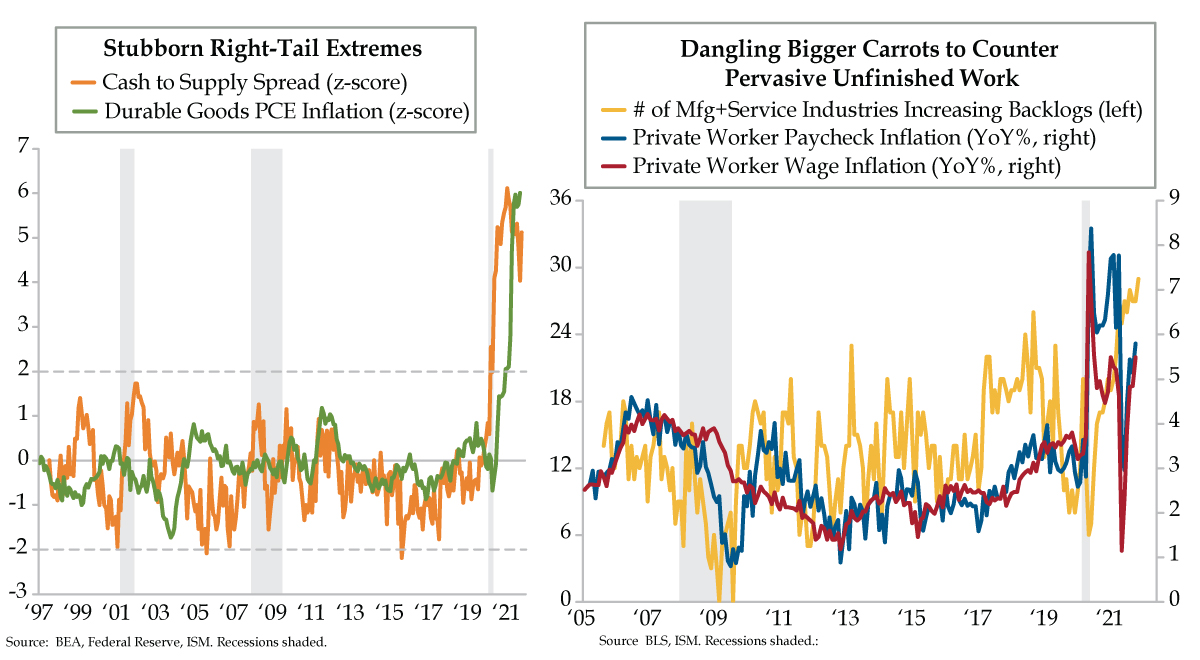
- In the NFIB October survey, a record 51% of small business owners said they plan to raise prices in order to combat higher material, transport, and labor costs; with core PCE printing at 4.4% vs. the 2% target, the latest CFO Survey also validates the rising input cost dilemma
If you harbor an obsession with the Banzai Pipeline Hawaii, known worldwide for its perfect barreling waves, head to Ehukai Beach Park on Oahu’s North Shore. Surfing pipeline is a unique experience like no other and ranks high on hardcore surfers’ bucket lists. The location’s name combines the surf break (Pipeline) with the name of the beach fronting it — Banzai. The spot is also rich in history. In December 1961, legendary surfing producer Bruce Brown was driving up to the North Shore with Californians Phil Edwards and Mike Diffenderfer. He stopped at the then-unnamed site to film Phil catching several waves. Coincidentally, on adjacent Kamehameha Highway, there was a construction project for an underground pipeline underway, prompting Mike to suggest the break be named “Pipeline.” The reference was first used in Bruce Brown’s movie Surfing Hollow Days and went on to be the name of a 1963 hit by surf music rockers The Chantays.
Those who dabble in the science of the dry know there’s a lower-case ‘pipeline,’ as in the production pipeline. Each month, the producer price index (PPI) report dives deep under the waves to unearth pipeline price pressures. With “supply chain” trending and inflation trades all the rage, a more delicate dissection of the PPI should be on the to-do list of true bond vigilantes…or those with a fundamental hankering for going into the weeds, like QI’s Dr. Gates.
Gates’s old-school perspective requires PPI metrics be referenced by their stage of processing — ‘crude,’ ‘intermediate’ and ‘finished.’ When pipeline pressures would build in past cycles, the Street would monitor sets of waves in crude, intermediate and finished goods PPI inflation to gauge whether pass-through from the supply chain would generate upward movement in consumer prices. Then globalization happened (read: China entering the World Trade Organization in 2001). Being a pipeline watcher was relegated to the Mesozoic Era. The trade war and, more forcibly, the pandemic’s effect on the supply chain reasserted the idea of waves into the price setting mechanism.
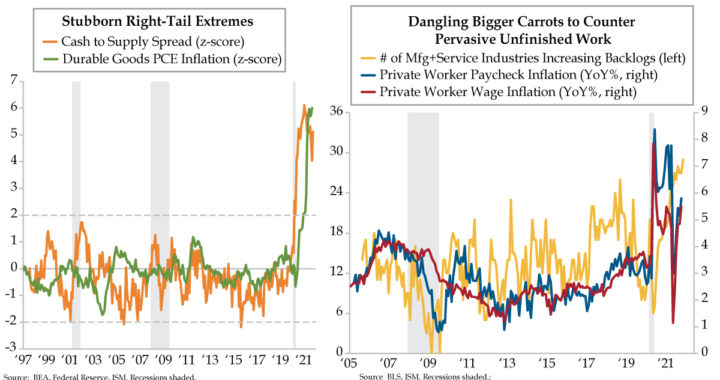
Watching pipeline costs entails more than assessing inflation risks; they also matter for the growth outlook. Take the pipeline cost spread (purple line), defined as the spread between intermediate and finished goods PPI inflation. Over the last 50 years, many waves are visible through business cycle expansions. The current episode, however, echoes 1970s-style inflation risks. Yesterday’s PPI report revealed that intermediate PPI inflation has exceeded that of finished goods by a double-digit margin for six consecutive months ended October. In the last half century, with respect to duration, only the seven-month stretch from July 1974 to January 1975 compares.
History doesn’t repeat itself, but it sometimes rhymes. Not surprisingly, 1974’s persistent cost pressures coincided with a decline in the ‘it-girl’ – the ISM Manufacturing New Orders index. The upstream cost bulge in 2021 has seen this metric fall out of the right tail distribution, ending a 15-month winning streak north of the lofty 60 mark (green line). Is there more to come?
Because of its stalwart postwar track record, U.S. ISM Manufacturing New Orders provides a signal for firms of all sizes, including those on Main Street. The 1974 experience saw a sharp decline in small business economic expectations. In 2021, the path has similarly led to near record pessimism (orange line). QI friend and mentor National Federation of Independent Business (NFIB) Chief Economist Bill Dunkelberg put it this way: “Not knowing the course of federal economic policies (e.g., taxes) makes it harder to make the investment expenditures that will be needed to raise worker productivity. Add to that the unclear course of the virus and associated government policies and owners face an economy filled with uncertainty that must be resolved to figure out the likely course of the economy.”
Moreover, small business owners capitulated on their future view of the economy view by flagging a further deterioration in earnings (red line) and a stalling in expectations for real sales volume over the next six months (light blue line). With profits challenged and revenues expected to stall, what’s a proprietor to do in this higher material, transport and labor cost environment? In October, a record 51% said they planned to raise prices to combat this testy triumvirate (yellow line).
The latest CFO Survey validated: “Most CFOs also indicate in the third-quarter survey that their firms are experiencing supply chain disruptions that are expected to last well into 2022 [and]…Small firms note less ‘room to maneuver’ and are more likely to report waiting for supply chain issues to resolve themselves.”
Federal Reserve Vice Chair Richard Clarida would concur. In (very) prepared remarks, the Fed official who wrote the book on inflation expectations dictating monetary policy, dryly noted that he, “would not consider a repeat performance next year a policy success.” Though he towed the party line, noting that the 4.4% increase in the PCE — which the Fed traditionally hid behind to keep Quantitative Easing humming, was a “moderate overshoot” (or more than double) the Fed’s 2% target, it must have been painful to be conciliatory when inflation expectations have gone haywire.
Perhaps Clarida is trying to ride the wave until January 31st, when his term ends, and vacate the Eccles Building before the inevitable wipeout hits. With pipeline cost pressures persisting, the risk of inflation psychology becomes ingrained into Main Street business decision-making. Adjusting to such an environment may not be smooth surfing.