Shake a Tail Feather

VIPs

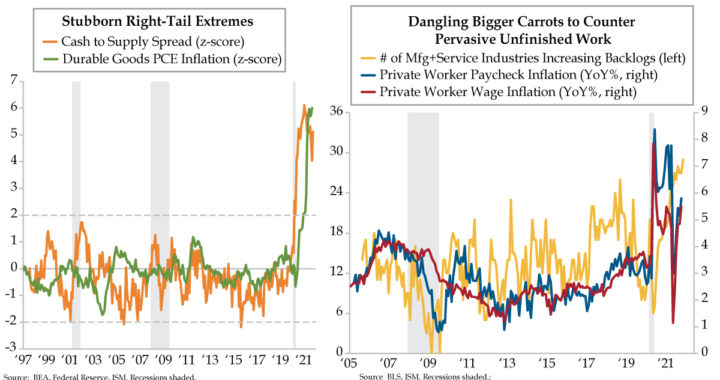
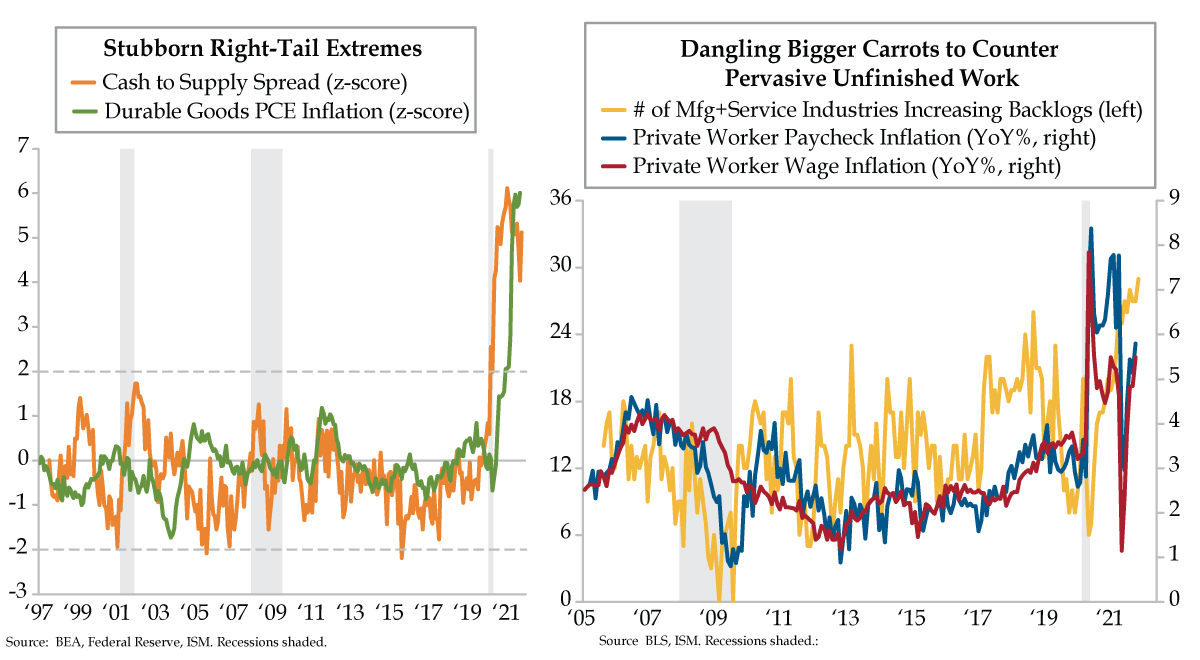
  • The Cash to Supply spread, comparing cash equivalents to ISM inventories, has been above a +2 z-score for 18 months and was +5 in October; the series leads durable goods inflation, which snapped its 25-year deflationary trend last year and registered a +6 z-score this month
  • Per ISM, backlogs are increasing in 29 out of 36 industries across manufacturing and services, a record high; as a result of the bottlenecks, the U.S. labor market is seeing earnings growth in the right-tail, with both paycheck and wage inflation above the 5% YoY threshold
  • Yield curves steepened after yesterday’s tapering announcement by the Fed, though Powell held firm on decoupling tapering from rate hikes; however, the potential for further flattening long-term remains strong as evidence continues to defy the transitory narrative


“Excuse me, I don’t think there’s anything wrong with the action on this piano.” And at that point, the proprietor of Ray’s Music Exchange sat down at the keys and broke into an upbeat rendition of “Shake a Tail Feather” prompting the whole neighborhood to show off their best dance moves. It was all done to convince The Blues Brothers that the electric piano — for which Ray (as in Charles), was willing to throw in the black keys for free — was the best in Chicago. There never was an actual store called Ray’s Music Exchange. The mural everyone danced in front of on the Prairie Avenue side of the building at 300 East 47th Street in Chicago was painted during the production of the cult musical comedy in 1979. Among the artists depicted were Charles himself, Muddy Waters, Mahalia Jackson, B.B. King, Dizzy Gillespie, Curtis Mayfield and Stevie Wonder. Sadly, the wall painting that celebrated these great musicians and drew fans of the movie from around the world for 40 years was sacrificed when the building was demolished following a fire in 2020.

Speaking of shaking tail feathers or just tail of a distribution… Regular readers appreciate our affinity for the great normalizer, the z-score. If you’ll indulge a bit of nerdiness, this metric contextualizes statistics in a standard normal distribution. There is a special normal distribution with a mean of zero and standard deviation of 1. The standard normal distribution is centered at zero and the degree to which a given measurement deviates from the mean is given by the standard deviation. For the standard normal distribution, 68% of the observations lie within 1 standard deviation of the mean, 95% lie within two standard deviation of the mean, and 99.9% lie within 3 standard deviations of the mean.

With that lesson on probability behind us, focus your lens on today’s left chart, which updates a chart we published in May. The Cash to Supply spread (orange line) is an inflation leader that combines cash equivalents (money of zero maturity, MZM) against inventory sentiment measures from both Institute for Supply Management (ISM) manufacturing and service reports. This gauge was created in the spirit of Milton Friedman’s “too much money chasing too few goods” mantra that all students of the dry science learn via osmosis with other economists.

The ebb and flow in the Cash to Supply spread has tended to track and lead that of pricing for durable goods over time. This is the part of the inflation mosaic that’s been significantly altered in the post-COVID era. For 25 years prior to the pandemic, durable goods prices were in deflation. That ended in 2020 and the segment’s inflation has stretched into 2021. The durables deflation/inflation rate has been z-scored (see above and simply put, deviation from the mean adjusted for volatility applied) to level the comparison with the Cash to Supply spread, which itself, is a difference of two z-scores.

Recall the standard normal distribution definition and examine all the data points that fall between the dashed horizontal lines of -2 and +2 z-scores. Most of them fall within that range. Only the far right of the chart has risen well north of +2 and has yet to show decided momentum to fall back within the usual historical range. In fact, the Cash to Supply spread has been obstinately above a +2 z-score for 18 straight months and most recently snapped back above a +5 reading in October, persistently flagging too much money chasing too few goods. Durable goods inflation has persistently exceeded +2 on the z-scale for 10 months in a row and in October registered a +6. This is not an episode of The Twilight Zone. These stubborn extremes continue to shake a tail feather at Team Transitory.

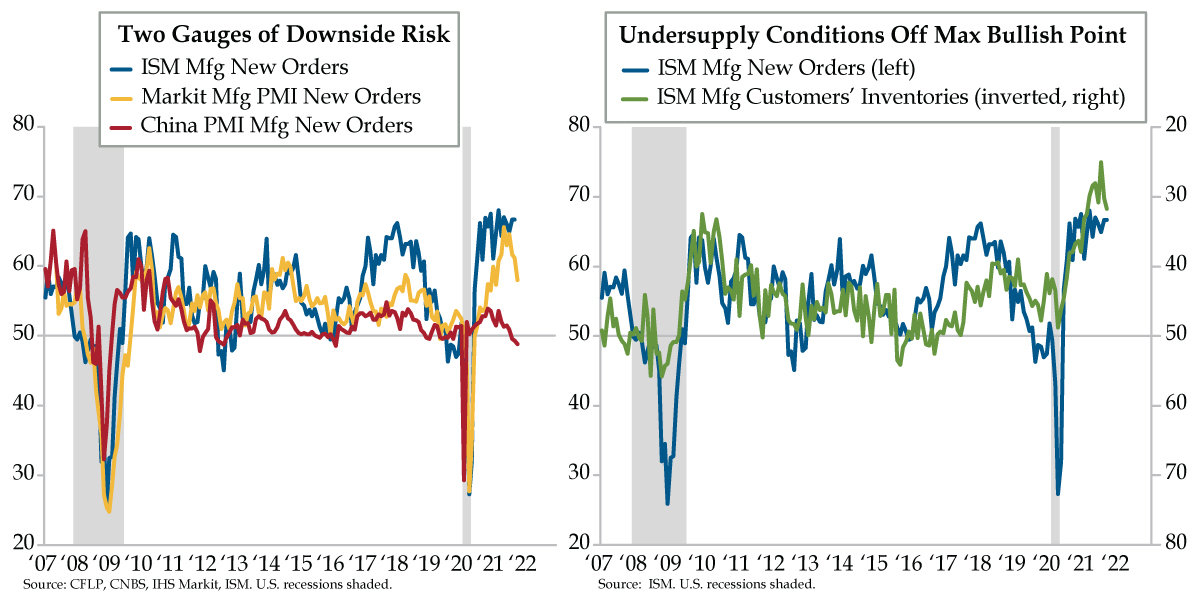
A large cash pile and an undersupplied supply chain aren’t the only right-tail observations that prevail today. As you see in today’s right chart, backlogs across the U.S. economy have become so pervasive as to be occurring in 29 out of the 36 industries designated by the manufacturing and service sectors combined (yellow line). This. Has. Never. Happened. Before.

Note that widespread backlogs signal unfinished work. To pare down the pile of domiciled inboxes from input shortages, transport delays and lack of warm bodies to fill positions, larger carrots have been dangled across the workforce in the form of higher wages. Longer hours go hand in hand with an environment of rising unfilled orders. Ergo, paychecks follow by fattening like Thanksgiving turkeys readying for slaughter. COVID base effects have washed out of year-over-year comparisons for wages (red line) and paychecks (light blue line). Readings above the 5% threshold for both gauges tell us we’re in a right-tail environment in the U.S. labor market.

It doesn’t take a legendary, blind soul music genius like Ray Charles to see that a leader of inflation in durable goods has persevered outside the distribution for the first time since the late 1990s and is refusing to normalize. Wage pressures also are bubbling as backlogs have never bulged to this extent. Yield curves steepened after yesterday’s Fed taper announcement as Fed Chair Powell held firm on divorcing the process of tapering from rate hikes. That said, those betting on a flattening bias should not be deterred. Team Transitory keeps losing its fan base.

Autos to Slump or Not to Slump?

QI TAKEAWAY —  Auto buying conditions across the income stack are severely challenged due to sticker shock. Notably, the biggest earners and biggest buyers are the most pessimistic. Vehicle pricing has an inverse relationship with sales over time. If the current run-up in auto inflation proves transitory, the consensus is correctly positioned with its auto sales optimism. Due to the magnitude of the demand pull forward, if the consensus is wrong, the risk is a slump in sales that would have ripple effects across the global auto complex.

  1. Lower, middle, and upper-income cohorts all had net pessimism regarding auto buying conditions, at -24%, -30%, and -35%, respectively, in October, per UMich; upper-income buyers have been the most pessimistic group in the last three months, not seen since 1981
  2. Since 1967, the correlation between CPI new vehicle inflation and new vehicle sales has been -0.47, with sales tending to rise when price rises moderated or fell; at roughly 9% YoY, current new vehicle inflation calls back to the 1970s, when sales ran at a 5-10 million SAAR
  3. Though October sales bounced back slightly to a 12.99 million SAAR, the downtrend since April’s 18.3 million still has room to run; the stellar bounce back to 16.3 million SAAR in 2022 is predicated on supply chains normalizing & demand not having been pulled forward

Duck Test

VIPs

  • Lower, middle, and upper-income cohorts all had net pessimism regarding auto buying conditions, at -24%, -30%, and -35%, respectively, in October, per UMich; upper-income buyers have been the most pessimistic group in the last three months, not seen since 1981
  • Since 1967, the correlation between CPI new vehicle inflation and new vehicle sales has been -0.47, with sales tending to rise when price rises moderated or fell; at roughly 9% YoY, current new vehicle inflation calls back to the 1970s, when sales ran at a 5-10 million SAAR
  • Though October sales bounced back slightly to a 12.99 million SAAR, the downtrend since April’s 18.3 million still has room to run; the stellar bounce back to 16.3 million SAAR in 2022 is predicated on supply chains normalizing & demand not having been pulled forward


“If it looks like a duck, swims like a duck and quacks like a duck, then it’s probably a duck.” Attribution for the phrase goes to the “Hoosier Poet” James Whitcomb Riley of Greenfield, Indiana. In 1849, he wrote: “When I see a bird that walks like a duck and swims like a duck and quacks like a duck, I call that bird a duck.” Over the years, this declaration has morphed into the so-called “duck test,” a form of abductive reasoning to determine the nature of an uncertain thing or situation, usually in the absence of, or in spite of, concrete evidence. The duck test’s logical inference starts with an observation or set of observations and then seeks the simplest and most likely conclusion from the explanation.

Does the duck test apply to price shocks? Over the course of U.S. business cycle history, the most convincing price-shock duck test coincided with spikes in crude oil prices. The Arab oil embargoes that generated the energy crises (plural) of the 1970s have a place in the history books – and get a passing grade, for sure. The Iraq invasion of Kuwait which ushered in the Gulf War and the 1990-91 recession saw oil prices double from $20 per barrel to $40 and also meant there was a high probability that we had a small aquatic bird of the family Anatidae on our hands. In all cases, prices at the pump surged, and the most visible price in the U.S. economy, that of retail gasoline, created the pain point for purchasing power.

What about an auto price shock? Sure, consumers are now able to view prices more readily than in past economic cycles with the advent of the information age and price transparency by auto manufacturers and auto dealers. Who hasn’t used cars.com or Kelley Blue Book or Edmunds?

But an auto price shock wouldn’t and couldn’t generate the buy-now mentality and urgency of an oil shock. Gasoline is a high frequency purchase measured in weeks. Auto-buying frequency is measured in years. Buyers observe prices and price movements more frequently with the former than the latter. That said, this statement is disproved in today’s left chart.

The entire income distribution has coalesced around the vehicle price narrative. Prices have become such an impediment to buying conditions that lower-, middle- and upper-income households all indicate that it’s a bad time to buy. For the past six months, there have been fewer respondents stating it was a good time to buy because of low prices relative to those who said it was a bad time to buy due to high prices. As recently as March, all three groups registered optimism with regard to prices: lower at 4%, middle at 9% and upper at 13%. In October, pessimism reigned: lower at -24%, middle at -30% and upper at -35%.

The most unique thing about the past three months was that upper income buying conditions related to prices were worse than both the middle and the lower tiers. This inversion from the top down in August, September and October was only equaled one other time in history: November 1981. For perspective, the biggest earners are the biggest spenders when it comes to new vehicle consumption. About 60% of cars and trucks are bought by the top-third, roughly 30% by the middle-third and around 10% by the bottom third, according to the Bureau of Labor Statistics’ 2020 Consumer Expenditure Survey.

Since the late 1960s, new vehicle inflation has been inversely related to new vehicle sales. The correlation between the right chart’s two series has been -.47 since 1967. This mirror image chart shows automakers consistently sold more product when price increases were moderate (between 0% and 5%) or declining. Current consumer price inflation for new vehicles around a 9% year-over-year rate harkens back to the 1970s, when sales trended between a 10 million to 15 million seasonally adjusted annual rate (SAAR). At the extreme, inflation above 9% led to a sub-10 million SAAR.

A cross check with the first chart’s outlier – November 1981 – lead us to ask: “What if auto price shock turns to slump?” What followed the inversion in the income distribution back then was a capitulation at a lower SAAR. In the 12 months that followed November 1981, sales averaged 10.2 million. Even though we saw a slight bounce in October sales to an unrounded 12.99-million SAAR rate, if history repeats itself, the downturn that started from April’s 18.3 million SAAR still has room to run.

To be sure, persistently high auto inflation would have to hold to generate a persistent sales slump. Whether we have all the details correctly placed in the current risk scenario is a moot point. What we do know is that the consensus anticipates a bounce back in the SAAR from 15.5 million in 2021 to 16.3 million in 2022 to 17.0 in 2023 before leveling off in the high 16s out to 2027. Underlying that medium-to-longer run outlook are two assumptions – shockingly high auto prices will fall back as the supply chain normalizes in the next two years and that unprecedented levels of stimulus-spending have not pulled forward an unparalleled level of demand.

A duck test for a slump in auto demand due to high prices only can be harvested over the next year. At least we know the consensus is pricing for the opposite to occur.

Safety in Non-Cyclicals

QI TAKEAWAY —  The closely followed ISM New Orders-to-Inventories spread compressed sharply in October and points to reduced production shifts across the manufacturing complex. Lead times echoing the 1970s inflation era also mean a slowdown in the production process and higher leverage to manage through the environment. Favor companies with less exposure to the supply chain, especially non-cyclicals.

  1. The ISM New Orders-Inventories spread shrunk to 2.8 in October, the lowest since last year’s re-opening; as a z-score, this is below trend at -0.67, and mimics the rest of the world, with only 59% of major economies seeing spread expansions, the worst since June 2020
  2. The factory workweek plus overtime collapsed from 45.7 hours in February 2020 to a low of 41.3 hours in April amidst pandemic shutdowns; since recovering in January, performance has been up-and-down, before settling just below January’s print at 45.6 hours in September
  3. ISM’s lead time commitment for production material advanced to 96 days in October from September’s 92 days; higher upstream costs have manifested into a near-record level of credit extension, with the NACM’s Credit Managers’ Index registering a 70.0 print in October

History’s Hometown

VIPs

  • The ISM New Orders-Inventories spread shrunk to 2.8 in October, the lowest since last year’s re-opening; as a z-score, this is below trend at -0.67, and mimics the rest of the world, with only 59% of major economies seeing spread expansions, the worst since June 2020
  • The factory workweek plus overtime collapsed from 45.7 hours in February 2020 to a low of 41.3 hours in April amidst pandemic shutdowns; since recovering in January, performance has been up-and-down, before settling just below January’s print at 45.6 hours in September
  • ISM’s lead time commitment for production material advanced to 96 days in October from September’s 92 days; higher upstream costs have manifested into a near-record level of credit extension, with the NACM’s Credit Managers’ Index registering a 70.0 print in October


About 30 miles southwest of Syracuse in the Finger Lakes region of upstate New York sits a small city rich in American history. Auburn, New York has been dubbed “History’s Hometown” as it’s a hub of key figures, events and culture with attractions pertaining to the Civil War era, the Underground Railroad and the birthplace of talking films. Even the 1888 invention of the time clock is linked to an Auburn jeweler — Willard Le Grand Bundy. He patented his design two year later and he and his brother, Harlow, thus formed the Bundy Manufacturing Company to mass-produce time clocks. In 1900, the time recording business of Bundy Manufacturing, along with two other related businesses, consolidated into the International Time Recording Company (ITR). In 1911, ITR, Bundy Manufacturing, and two other companies were amalgamated (via stock acquisition), forming a fifth company — Computing-Tabulating-Recording Company (CTR). Ultimately, it would change its name to International Business Machines, better known today as IBM.

Time clocks, or punch clocks, usually were reserved for hourly workers to record their toiling in manufacturing and service occupations. Employees punched in to start their workday and punched out to end it, sometimes with the asterisk of overtime hours being documented. This Friday’s U.S. employment report for October will provide the latest update for the private nonfarm economy.

Each month, only the most cyclical industries in manufacturing provide a prism into both average weekly hours and average overtime hours. No other private sector industries report this level of detail to the Bureau of Labor Statistics. The COVID-19 shock saw the factory worker workweek plus overtime collapse from 45.7 hours in February 2020 to a cycle low 41.3 hours in April 2020. Nine successive monthly gains later and full recovery was achieved in January 2021. Since then, however, the performance has been anything but streaky. Ups and downs have punctuated 2021; by September, this metric stood marginally below where it started the year, at 45.6 hours.

For cyclical indicators, a bumpy ride typically foreshadows a turn in the trend. Judging from the relative distance between demand and supply for forward guidance, there is a greater risk that hours get lowered than raised. This read can be gleaned monthly via the new orders to inventories spread in manufacturing from the Institute for Supply Management (ISM). At face value, the spread compressed to 2.8 in October, the lowest since the involuntary bounce back occurred after the height of the pandemic, in Spring 2020. Over the last several years, a reading like this, however, would be considered below trend, at -0.67 (red line) – the context for which is attained by applying our favorite normalizing z-score process (deviation from the mean adjusted for volatility).

The new orders-inventories spread gauges near-term output prospects, which carries over into predicting working hours. A wider spread suggests stronger activity and longer hours to get the job done. When the combination of orders-inventories compresses, as is the case today, this bearishly indicates fewer labor resources are required. The easiest “fix” is adjusting hours. The normalized year-over-year trend in the production workers’ workweek plus overtime (blue line) looks set to slide below trend just like its ISM guide.

The global environment provides a backdrop for the narrative of punching shorter time clock hours which can be observed across the mosaic of global manufacturing purchasing manager indices (PMIs). Of the 41 countries we track, the breadth of expansion in new orders-inventories has declined to 59% so far in October, the least positive performance since June 2020 (green bars).

ISM expounded at length “that their companies and suppliers continue to deal with an unprecedented number of hurdles to meet increasing demand. All segments of the manufacturing economy are impacted by record-long raw materials lead times, continued shortages of critical materials, rising commodities prices and difficulties in transporting products. Global pandemic-related issues – worker absenteeism, short-term shutdowns due to parts shortages, difficulties in filling open positions and overseas supply chain problems – continue to limit manufacturing growth potential.”

Persistently elongated lead times increasingly slow the production process. Look no further than ISM’s lead time series for production material commitments. Last month, we noted that the time it took to acquire these key inputs rose to an average of 92 days in September, comparing only to the longest postwar lead times encapsulating the 1973-74 period. October offered no relief — this metric advanced to 96 days (orange line). Reading truckers’ anecdotes suggest the prolongation will persevere as the supply chain’s disruptions don’t get resolved until well into 2022, regardless of whether demand plummets in the interim.

Lead times echoing the 1970s inflation era translate into the need to attain higher leverage as the most cyclically exposed industries’ budgets get busted. The risk is that it flows down the distribution chain to service industries with the highest supply-chain exposure. The purple line depicts how the higher upstream cost backdrop has manifested itself into a near record level of credit extension (70.0 on a 50 breakeven) across both the manufacturing and service sectors, according to the October National Association of Credit Management Credit Managers’ Index.

Time clocks look set to get punched with shorter workdays as worsening vendor performance moves in gray clouds over the short-run industrial outlook. Expect the collective of the Street forecasting community to roll out the catchphrase “mid-cycle slowdown” to describe this episode. A better characterization would be the new darling term of “bottleneck recession.”

China’s Economy Still Matters

QI TAKEAWAY —  China’s slowing will inevitably induce a deflationary impulse, which is on approximately no one’s radar. The urge to stay on the curve steepening trade should be resisted as this inherently reinforces curve flattening.

  1. China’s manufacturing PMI was 49.2 in October, just below September’s 49.6 print as energy remains constricted; crude stockpiles hit 919 million barrels by October 24, 59% of capacity and the lowest since November 2018, and 13% of coal capacity remains offline
  2. At 31.7, ISM Mfg Customers’ Inventories are at their highest levels since February, despite lingering supply chain woes; as is the case with China, the globe’s marginal driver of demand, New Orders in the U.S., appear set to decline as inventories are replenished
  3. China’s services and construction PMI had a headline of 52.4 in October, shy of the 53.0 consensus forecast and well below September’s 53.2; economic activity in the world’s second largest economy is at the cusp of contracting, bringing with it a sizable deflationary impulse

The Ties that Bond


VIPs

  • China’s manufacturing PMI was 49.2 in October, just below September’s 49.6 print as energy remains constricted; crude stockpiles hit 919 million barrels by October 24, 59% of capacity and the lowest since November 2018, and 13% of coal capacity remains offline
  • At 31.7, ISM Mfg Customers’ Inventories are at their highest levels since February, despite lingering supply chain woes; as is the case with China, the globe’s marginal driver of demand, New Orders in the U.S., appear set to decline as inventories are replenished
  • China’s services and construction PMI had a headline of 52.4 in October, shy of the 53.0 consensus forecast and well below September’s 53.2; economic activity in the world’s second largest economy is at the cusp of contracting, bringing with it a sizable deflationary impulse


Shame on Daniel Craig for catalyzing an existential crisis. Prior to this momentous development, there was great confidence in the halls of QI that the late Sir Sean Connery would never be dethroned as the best James Bond of all time. Alas, No Time to Die has scuttled the rankings. On Sunday, we re-watched the movie on the big screen, which itself is a post-pandemic treat. Spoiler alert: (many) Kleenex were needed the second time around. The quote M reads at the end was as fitting as could be for a Bond who makes the ultimate sacrifice for God, country and, indeed, the world. Written by American author, journalist and social activist Jack London, who was most famous for penning the novel The Call of the Wild, M’s tribute was as suitable as it was heart-wrenching: “The proper function of man is to live, not exist. I shall not waste my days in trying to prolong them. I shall use my time.”

It would seem Chinese officials are wasting no time broadcasting the country’s economic slowdown. October’s manufacturing PMI was 49.2; a tad lower than the 49.6 reported last month. We know what’s going on – energy in every form is being conserved to the extent diesel fuel is being rationed. As of October 24th, China’s crude stockpiles had fallen to 919 million barrels, 59% of capacity and the lowest since November 2018. Meanwhile, 13% of China’s coal capacity is offline, which equates to about 60 mines. These are meaningful figures when China’s energy consumption is more than 70% coal. A colleague sent a photo of Beijing a few days ago and the skies were blindingly blue. It’s a bit premature for this to be the case given the 2022 Olympics don’t begin until February. One final note on this count is that we forget that Russia is squeezing both Europe and China.

Ex-energy, high commodity prices are likely biting harder as a factor of time given China has been parsing out hoards amassed at cheap prices when the rest of the world was in shut-down mode. And officials are also attempting to slowly blow up its property sector and this isn’t the first time they’ve tried to control this exact same experiment. We could see a shockingly low print for fourth quarter GDP…and officials know it, which means it’s likely worse than most can conceive. As our friends at Gavekal Dragonomics told the Financial Times, “what was an anticipated slowdown in China following the post-Covid boom of the first half of 2020 has evolved into a ‘shocking loss of economic momentum.’”

As for what’s to come, in the same spirit we’ll be glued to our Bloombergs to see where ISM New Orders (blue line) hits the tape this morning, China’s manufacturing PMI New Orders (red line) are closely followed due to their role as being a leading indicator. In February 2020, this gauge crashed to 29.2 but bounced right back to 52.0 the next month. Comparing October’s 48.8 reading to this moment in time is thus a bit of a red herring. The closest legit comparison is February 2016, when the world was embroiled in an industrial recession. Today’s left chart is as self-explanatory as they come – as long as China remains the marginal global consumer of you-name-it, what’s unfolding in China today will induce deflation worldwide. While it might not be perfectly synched, New Orders in the U.S. will be following China’s into the red. In the case of IHS Markit, which reflects all sizes of companies across the U.S., New Orders’ descent is more advanced (yellow line).


Call today’s right chart corroborating evidence of its sibling on the left. Customer Inventories are another precursor to New Orders. To depict the trend, we have to invert the series (green line) – inventories up mean less demand to accomplish the post-pandemic nearly impossible task of fully re-stocking. And yet, we see that firms have been grinding away at this task for months now as inventories, at 31.7, are at the highest level since this past February. That’s saying something given the gnarled supply chain at ports only shows signs of worsening. The sole factor that fills in the blank against such a backdrop is declining demand that’s permitting inventories to build despite how difficult it is to source inputs of all stripes and flavors. As is the case with China’s PMI New Orders, ISM’s New Orders will succumb to the gravity of rising Customer Inventories.


For all of the hullaballoo over the weekend surrounding China’s sanctioning the communique that its factory sector is slowing, the bigger news was its non-manufacturing sector in October, which represents services and construction. The headline slowed to 52.4, shy of the consensus forecast of 53.0 and a marked departure from September’s 53.2. Tally the data and you get to 50.8 at the composite level. Economic output of the world’s second largest economy is at the cusp of contracting.


And in the world’s largest economy? With yet another “hoped-for” vote for the bipartisan infrastructure spending program tomorrow, we remain sidelined, in the ‘believing it when we see it’ camp. God help us if the bigger social spending gets miraculously passed alongside it – U.S. household budgets are already being suffocated by inflation headed into the holiday season. We can only imagine the stress of families having to tussle with it being no time to die come Christmas.