VIPs
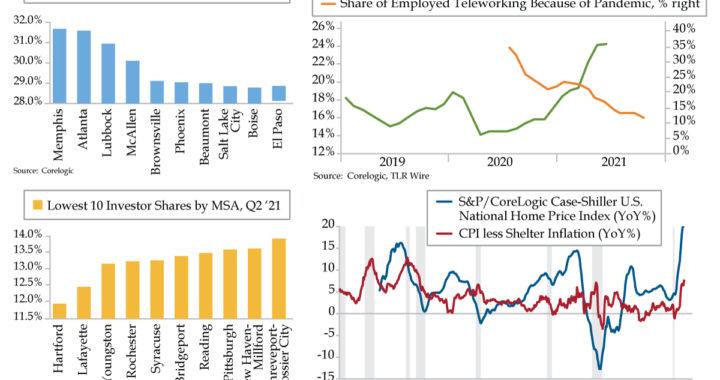
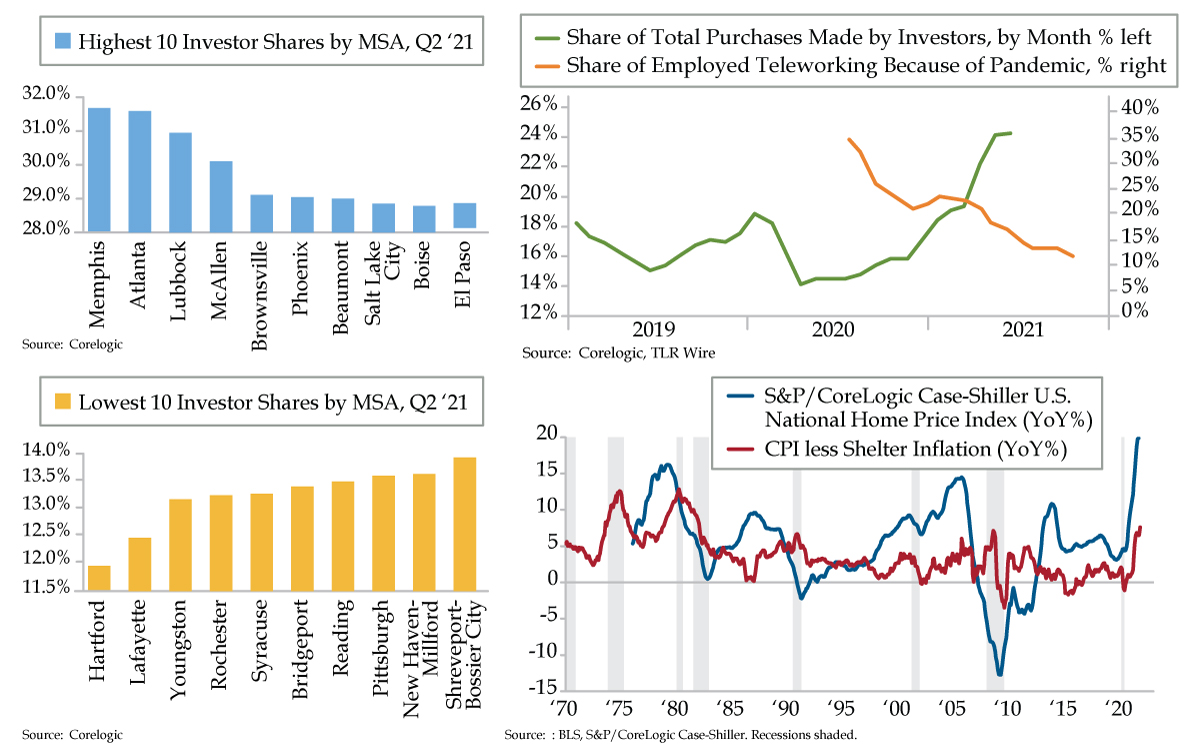
- Per CoreLogic, Memphis is the most desirable housing market for investors, with the rest of the top 10 spread across the South and Mountain-West; conversely, the least attractive housing markets for investors, save for two cities in Louisiana, are in the Northeast
- Pre-pandemic moratorium, Memphis historically had one of the highest eviction rates of any MSA at 6.1%; this suspension of lower-end supply sent rent inflation 19% over the 2014-2020 trend-line, but as evictions resume, new supply should give a reality check to investors
- The share of employees working from home has now fallen from 35.4% of the workforce in May 2020 to just 11.6% last month; with investors doubling down on their housing market purchases in spite of this, oversupply could soon apply pressure to an overheated market
You thought “Walkin’ in Memphis” was only possible in Tennessee. The truth is, you’d have had to first “Walk Like an Egyptian.” Memphis, Egypt is the city from which the one synonymous with Bar-B-Que derived its name. “Memphis” is the Greek adaptation of “Men-nefer,” meaning “enduring and beautiful.” In contrast to Nashville, the Memphis of the Egyptian era was the capital of ancient lower Egypt circa 3000 BC. You don’t have to travel halfway around the world, however, to visit a different Memphis. The states of Alabama, Florida, Indiana, Michigan, Missouri, Nebraska, New York and my home state of Texas boast them. With a population of 2,215, the Texas town was nameless upon its 1889 founding. As legend holds, a reverend saw a letter addressed to Memphis, Texas, to which he said, “There’s no such town in Texas.” With that, the town was christened…accidentally. Though small in population, Memphis, Texas boasts five newspapers and local TV channels and three radio stations.
Unlike the Texas town, investors have swarmed Tennessee’s Memphis. CoreLogic identified Memphis as the most desirable Metropolitan Statistical Areas (MSA) for investors. Note a pattern in the other top 10 – seven are in the South while three are in the Mountain-West. Conversely, with the exception of two Louisiana cities, the least attractive places to invest are in the Northeast. Booming economies vs. metros that have long been on life support. Fair enough.
But there’s a big however as it pertains to Memphis, and to a lesser degree Atlanta, one caught by the eagle-eyed Michael Green, QI colleague and Chief Strategist at Simplify Asset Management. As reported by Realtor.com, at 6.1%, Memphis has historically been the highest eviction market. (Atlanta ranks 3rd highest at 5.70%).
The background is key to the punchline. On March 27, 2020, the Cares Act imposed a nationwide rental eviction moratorium that expired, after multiple extensions, 18 months later, this past September 30th. Tack on another 30 days of grace – the notice that must be provided – and we’re about proceedings that started all of 12 days ago.
If we’re speaking in purely economic terms, the question is, “What does a suspension of reality produce?” In Green’s words, “When you cut off evictions, you cut off the left tail of a distribution since evictions primarily hit the lower end.” The upshot, unless you’re an investor buying into the market not aware of the dynamic, the result is that the protracted suspension sent rents in Memphis ripping off the 2014-January 2020 trend by 19%. At 10%, the effect was not nearly as pronounced in Atlanta, but it should still be a reality check for investors who’ve descended upon that MSA en masse.
While few anticipate such a development – payback is primed to be a bitch not just on the rental appreciation front, but also in housing supply, which we’ve described in detail in recent Quills as being approximately five times the 6.8 million housing supply deficit purported by the National Association of Realtors.
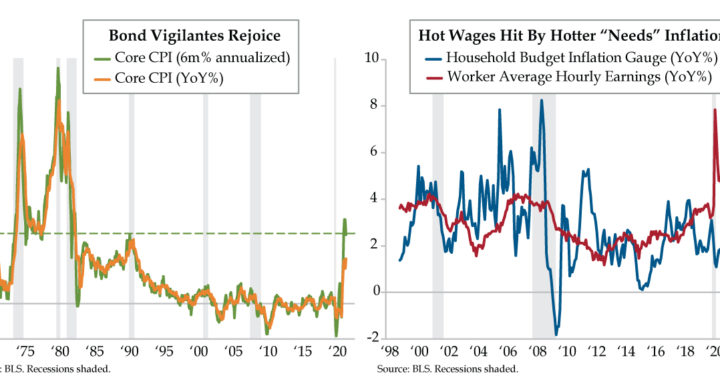
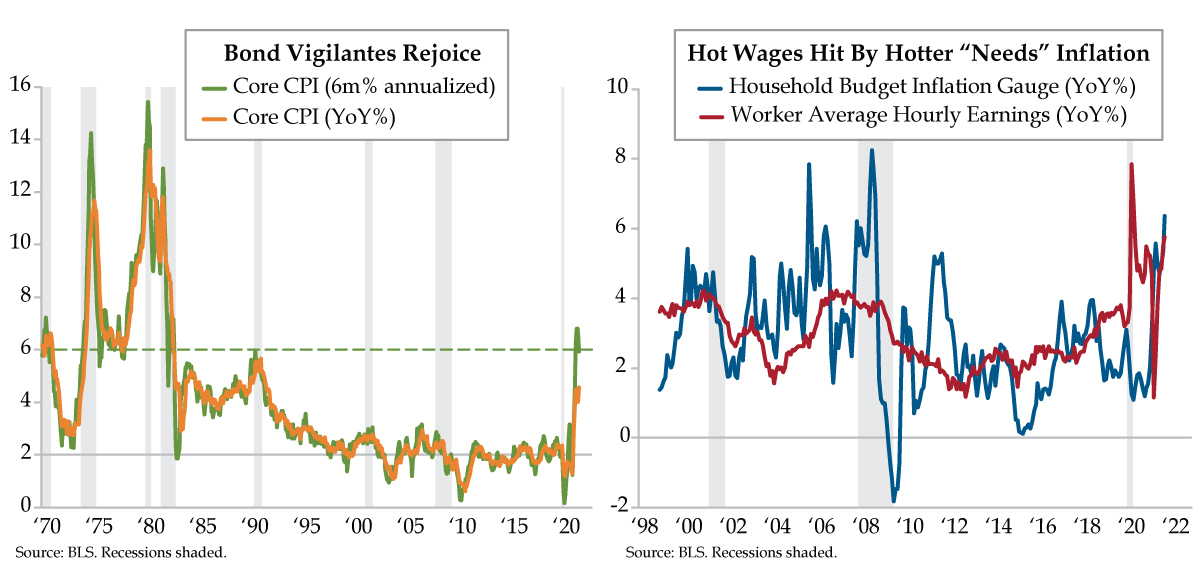
The Econ 101 of an unexpected overpricing and oversupply of homes conjures the concept of Owners’ Equivalent Rent (OER). To quote Wednesday’s Quill, OER is as false a proxy as could be devised – it can never reflect the S&P/Case-Shiller home price index or any other home price appreciation metric. Per the BLS: “Owner occupied units are not priced in the CPI Housing Survey.” Rather, owners are asked, “If someone were to rent your home today, how much do you think it would rent for monthly, unfurnished and without utilities?”
To add insult to CPI’s housing inflation, which is purely a hypothetical gauge of rental rates, they’re adjusted for hedonics the same way your iPhone is not more expensive than your Motorola flip phone because it does so much more than that old relic. To that end, if a given home in the six-month rotating pool of properties the BLS tracks sees a spike in this theoretical rental rate, it’s booted out under the assumption a major renovation has so improved the home to render the apples-to-apples comparison that of an apples-to-oranges, thereby disqualifying it.
The bottom line: Despite the hysteria surrounding the threat of home prices bleeding their way into the CPI in coming months, while some of the increase will filter through, reality will never be reflected in the BLS’ flawed metric.
The other reality is demurred by the media. As empowering a message as ‘Working from Home’ (WFH) is, this tony cohort has dwindled from 35.4% of the employed workforce in May 2020 to 11.6% last month. The question home investors: “Define the future into which you’re overpaying for homes to then rent out?” As you see in the upper righthand chart, the two trends are moving against one another – investors are doubling down even as WFH fades…that makes sense how?
To speak out of the other side of our mouth, there’s an undeniability to the long reach of housing at cycle outsets. Construction materials must be transported within U.S. borders or imported. The consumer picks up the baton via post-purchases. The real estate industry acts as a liaison for transactions, and the financial sector underwrites the mortgages and home insurance. Local governments then collect the property taxes. Housing is an economic conduit, which is manifest in the leading role it plays in ex-shelter inflation (bottom righthand chart). Don’t count it out, but don’t give it more credit than due given it’s been artificially propped.